Bitwise Launches Solana Staking ETP in Europe Amid U.S. Challenges

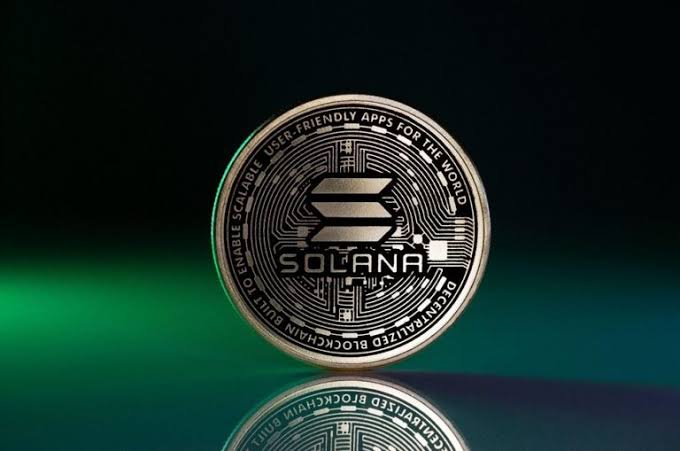
Bitwise, a leading crypto asset management company, has launched BSOL, a Solana staking exchange-traded product (ETP), in Europe. With staking privileges built in, this product enables investors to profit directly from Solana’s blockchain.

However, due to regulatory restrictions, similar goods in the United States can not provide such benefits. Bitwise signaled its readiness to launch staking-enabled ETFs in the United States by registering a Solana ETF trust shortly before this announcement. Other corporations, including VanEck, are considering similar programs, demonstrating the growing interest in Solana’s staking rewards, which currently provide larger yearly returns than Ethereum.

BSOL: A Competitive Edge in Solana Staking

The BSOL ETP stands out from traditional Solana ETPs by including staking rewards. These rewards are derived from Solana’s blockchain mechanism, where validators distribute earnings to incentivize staking. In the meantime, Solana stakers can earn an annual yield of around 8%, which is much better than Ethereum’s average staking APY. 

Bitwise Launches Solana Staking ETP in Europe Amid U.S. Challenges

Bitwise collaborates with Marinade as its staking provider, providing a competitive yield of 6.48% with a minimal management fee of 0.85% annually. In comparison, rival programs such as 21Shares provide lesser rewards (5.49%) and greater costs.

This makes BSOL a more appealing alternative for investors looking for steady earnings from Solana’s staking environment.

Regulatory Challenges in the U.S.

Due to existing securities regulations, Solana ETFs in the United States cannot offer staking incentives. Nevertheless, some analysts perceive that future regulatory changes, particularly a change in leadership at the Securities and Exchange Commission (SEC), could enable this. Bitwise is well-positioned to benefit from regulatory developments because of its investment in Solana staking infrastructure.

If the United States permits staking rewards, companies like Bitwise might leverage their European infrastructure to replicate similar products locally. Analysts warn, however, that Solana ETFs with staking rewards will most certainly face a longer regulatory timeline than Bitcoin or Ethereum-based products.

The Road Ahead

The launch of BSOL reflects Bitwise’s commitment to optimizing Solana’s staking opportunities in Europe while remaining prepared for potential changes in U.S. regulations. The market for staking-enabled ETPs is getting more competitive as companies such as VanEck enter the race.

For the time being, Europe remains a hotbed of staking ETP innovation, providing investors with a peek at a future that has the potential to change the crypto investment landscape in the US.


In order to place winning trades with us via Bybit, you can open an account here.

ApeCoin (APEUSD) Anticipates a Bearish Reversal

Price Analysis: APEUSD Anticipates a Bearish Continuation Following Failed Highs at the $2.460 Level

The recent price action reveals a notable shift in market structure, marked by significant bearish momentum. Following the formation of a major high at the $2.460 level, the market experienced a sharp decline that decisively broke the overall bullish structure. This bearish break occurred in late May 2024 when the price breached below the critical $0.980 level, continuing its descent to the $0.600 demand zone.

APEUSD Key Levels

Demand Levels: $0.980, $0.600
Supply Levels:$1.360, $1.850

ApeCoin (APEUSD) Anticipates a Bearish Reversal

At the $0.600 demand level, significant bullish momentum emerged, driving the price upward and reclaiming the $0.980 demand zone. This recovery was robust, with the price breaking above key supply levels at $1.360 and $1.850. However, as the price approached the major high at $2.460, bullish momentum began to weaken. A bearish reversal ensued, forming a failed high at this critical resistance level.

The daily Relative Strength Index (RSI) has confirmed the bearish reversal by signaling a decline from overbought conditions, further reinforcing the diminishing bullish momentum. On the 4-hour timeframe, the price exhibits a temporary bullish trend. However, the broader market trend remains bearish, and alignment with this trend is anticipated as the price approaches key support levels.

The price remains below the 4-hour Moving Average, signaling a bearish bias. A breach below the 4-hour bullish trendline is expected, signaling a continuation of the bearish momentum in line with the prevailing market structure.

ApeCoin (APEUSD) Anticipates a Bearish Reversal

Market Expectation

A decisive break below the 4-hour trendline is likely to accelerate the bearish movement. The price is anticipated to rechallenge the $0.600 demand level. Unlike the prior bullish recovery, this time, a complete breach of the $0.600 zone is expected, potentially establishing a new major low. Such a move would confirm the continuation of the bearish market structure.

You can purchase Lucky Block here.  Buy LBLOCK

Note: Cryptosignals.org is not a financial advisor. Do your research before investing your funds in any financial asset or presented product or event. We are not responsible for your investing results

Bitcoin (BTC) Price Prediction: BTC/USDT Bounces Off a New All-Time High

Bitcoin Price Prediction December 18:

The Bitcoin market recently hit a new all-time high at the $108,000 price level. However, currently, the price action of this token has rebounded downward in today’s trading activity so far. Nevertheless, the market stays at an elevated distance above key levels, which may assist upside forces shortly.

BTC/USDT Long-Term Trend: Bearish (Daily Chart)

Key Price Levels:

Resistance: $110,000, $115,000, $120,000

Support: $100,000, $95,000, $90,000

Bitcoin (BTC) Price Prediction: BTC/USDT Bounces Off a New All-Time High

The corresponding price candle to the ongoing session can be seen appearing bearish. This technically erased the modest upside correction of the past two sessions. Despite the moderate downward retracement, price activity stays above all the Moving Average (MA) lines. Meanwhile, the Stochastic Relative Strength Index (RSI) lines have already delivered a bearish crossover above the 80 threshold of the indicator.

Bitcoin Price Prediction: BTC/USDT Bears Look Threatening

Price activity in the Bitcoin market has undoubtedly achieved a new all-time high. However, it appears that the market seems to have equally drawn some bearish attention, as price action seems to have hit a significant amount of take-profit orders. Be that as it may, price action stays above all the MA lines. The last price candle on the chart stands above all the MA curves on the daily chart.

In addition, the Stochastic RSI has already delivered a bearish crossover in the overbought region. Consequently, all the available indications here imply that the downward forces are more dominant in this market at the moment. However, a more careful look at price action in this market may be necessary.

Bitcoin Price Prediction: BTC/USDT Eyes a Nearby Support Level (4-Hour Chart)

Price action in the Bitcoin 4-hour market has progressed below the 20-day MA curve. Also, a new session has begun there with the corresponding price candle appearing red. Meanwhile, price activity remains above the 50-, 100-, and 200-day MA curves. Despite these, the Stochastic RSI indicator lines have fallen deep into the oversold region of the indicator.

Bitcoin (BTC) Price Prediction: BTC/USDT Bounces Off a New All-Time High

By implication, indications emanating from trading indicators suggest that price activity is eyeing a nearby support level. Considering the movement of the Stochastic RSI line, it appears that the $103,000 may form a strong support. And if that fails, the $102,000 base level should hold.

Get Bitcoin here. Buy BTC

Dash 2 Trade Price Prediction for Today, December 18: D2TUSD Price Might Head to the $0.00460 Resistance Level

Dash 2 Trade Price Forecast: D2TUSD Price Might Head to the $0.00460 Resistance Level (December 18)

The D2TUSD pair has just begun its rising pattern, and the price might head to the $0.00460 resistance level as the crypto gradually faces high pressure from the bulls. Thus, a sharp breakout and closure above the current correction phase at the $0.00152 high value will invalidate any bearish thesis. Hence, the price might hit the high at the the$0.00460 resistance level and beyond.

Key Levels:
Resistance levels: $0.00152, $0.00153, $0.00154
Support levels: $0.000950, $0.000900, $0.000850

D2T (USD) Long-term Trend: Bullish (Daily Chart)

Dash 2 Trade remains in a bullish long-term outlook. The Bulls are trying not to fall this time around. Further, the coin prices are traded above the EMA-50, confirming a bullish trend.
Dash 2 Trade Price Prediction for Today, December 18: D2TUSD Price Might Head to the $0.00460 Resistance Level
The Dash 2 Trade price found resistance at the $0.00136 value above the moving averages after a series of dip lows in the previous action; this has made it easier for the coin to remain in a bullish trend zone in its recent high.

The bulls increased the D2TUSD price to the $0.00152 supply value above the EMA-50 shortly after the daily chart opened today, indicating that the buy investors are dealing in coin investments. Therefore, if the bulls can increase their tension in the market, the price tendency will move above the key levels.

The longer the price stays above the mentioned supply level, the more pressure builds up to reach a key significant level at the upside.

Next, the D2TUSD price indicates an uptrend on the daily stochastic, suggesting that the coin price may continue to surge and head toward the $0.00406 supply trend line in the days ahead in its higher time frame.

D2T (USD) Medium-term Trend: Bearish (4H Chart)

The D2TUSD pair reflects a bearish trend in the medium term due to the high order flow from sell traders. The price drop to the $0.00125 low value during the previous action has made the coin price trade below the supply levels in its recent high.
Dash 2 Trade Price Prediction for Today, December 18: D2TUSD Price Might Head to the $0.00460 Resistance Level
On the 4-hourly chart today, there is a broader recovery in the prices. The Dash 2 Trade pair jumped to a $0.00152 supply level below the moving averages as the bulls took to their stand in the market.

This bullish correction, however, indicates a gradual improvement in market sentiment and leads to more intraday gains in assets to higher prices. This will soon be invalidated as the trend has just resumed its rising pattern but has not yet reached its goal.

However, if the current supply at $0.00152 value ignites a sharp increase and closes above the $0.00265 resistance level, this rally may register a $0.00460 high value and beyond in its medium-term perspective.

Are you unsure about how to use $D2T to subscribe to Dash 2 Trade?


Want a coin that has a huge potential for massive returns? That coin is Dash 2 Trade. Buy D2T now.

EigenLayer (EIGEN/USDT) Signals Further Downtrend Amid Market Volatility

The general market sentiment of Eigenlayer against the Tether suggests a cautious market. It reflects a situation where the bulls are taking profit while the bears keep pushing the price towards a critical support level. This can be seen in the sharp decline in price from $5.586 at the upper band.

EIGEN against the USDT on a 4-hour timeframe is showing signs of further price dip with recent price movement reflecting a minor pullback towards the mid-band. However, the Bollinger Bands seem to be tightening, suggesting reducing volatility as the price struggles below key resistance near $5.100. Likewise, the Stochastic RSI aligns with signals of an oversold condition with more downside room in the near term.

Therefore, if the selling pressure towards the critical support levels continues, EIGEN may face further corrections before bulls attempt a recovery.

Currently, Eigenlayer is trading at $5.094 with a moderate 373.38 thousand.

EigenLayer (EIGEN/USDT) Signals Further Downtrend Amid Market Volatility
EIGENUSDT-4H Chart

Technical Indicators

Major Resistance Levels: $5.100, $5.300, and $5.586

Major Support Levels: $5.016, $4.450, and $4.200

EigenLayer Technical Analysis

The analysis of Eigenlayer shows that its price has recently dropped towards the mid-band at $5.016, signaling a bearish bias as the gaps between the bands reduce. However, a continuation of the trend below $4.450 seems likely if selling momentum is maintained. Conversely, a break above $5.016 would invalidate the bearish move.

On the other hand, the Stochastic RSI is declining sharply as the lines of the indicator head into the extreme oversold position. This indicates a strong bearish momentum and a continuation of the current trend. Therefore, the lines of the Stochastic reading at 2.99 for blue and 20.81 for orange need to cross over for a reversal to occur.

EIGEN/USDT Analysis: Recovery or Further Downtrend

In the 1-hour timeframe, EIGEN/USDT consolidates around $5.096 with clear bearish tendencies as the price struggles to recover from recent highs.

The Bollinger bands signal increased selling pressure with the price hovering next to the lower band at $4.972.

Additionally, the Stochastic oscillator shows an oversold condition, with the lines’ behavior showing a lack of bullish crossover. To this end, if the price fails at $5.100, a retest of the recent support level is possible.

Though the short-term sentiment leans bearish, with considerable low volume and sellers maintaining position, the bulls must reclaim key levels to counter the prevailing downtrend.

EigenLayer (EIGEN/USDT) Signals Further Downtrend Amid Market Volatility
EIGENUSDT-1H Chart


You can purchase crypto coins here. Buy Block

$SPONGE (SPONGE/USD) Gains Upward Traction

The $SPONGE market has shown a renewed surge in buying interest, rebounding from the critical support level at $0.00003, where price action had previously struggled for some time. This rebound has established a potential higher support level at $0.000037, which coincides with the current position of the 20-day moving average.

While market volatility remains elevated, signaling the potential for substantial price fluctuations, buyers are currently holding their ground above the 20-day moving average. This indicates that the bulls remain in control, at least for now.

Key Market Dynamics:

  • Resistance Levels: $0.00005, $0.000055, $0.000060
  • Support Levels: $0.000020, $0.0000195, $0.000019

$SPONGE (SPONGE/USD) Gains Upward Traction

SPONGE/USD Technical Outlook

Previously, the Bollinger Bands indicator reflected significant market volatility, driven by dramatic price swings that saw the market plunge to the $0.0000006 level. However, the bulls quickly seized the opportunity presented by this volatility, initiating a rally that pushed the price up to $0.00003, where they managed to establish a foothold.

This bullish effort brought a degree of stability to the $SPONGE market, which was subsequently mirrored by the Bollinger Bands as they converged into a narrow price channel. With the crypto signal now stabilized within this range, bullish price action has started to test higher levels, particularly above the $0.000055 mark.

$SPONGE (SPONGE/USD) Gains Upward Traction
$SPONGE (SPONGE/USD) 1-Hour Chart Insights

An analysis of the 1-hour chart reveals that the market is currently in a consolidation phase, though bullish sentiment has recently begun testing levels above $0.000055. The narrow, horizontally moving Bollinger Bands indicate that the market remains largely consolidated, despite these attempts to reach higher price levels.

The strong upward movement could be attributed to a few large buyers entering the market. However, the low trading volume raises concerns, as it suggests the market may still be vulnerable to rapid price swings. Nevertheless, in the last few trading sessions, the market has consistently maintained ascending lows—a positive signal for optimistic traders.

Buy SPONGE/USD!

Join the SPONGE community and be part of the next big crypto sensation! Buy Sponge ($SPONGE) today!

Tamadoge (TAMA/USD): The Bullish Resurgence Still Facing a Key Test

Following the market’s rejection at the $0.0016 price level, the bears appear to have gained a firm grip, leveraging this opportunity to drive prices downward. However, the TAMA/USD bulls have demonstrated resilience, attempting to reverse the trend at the $0.0013 price level. To succeed, they must contend with the prevailing bearish sentiment in the market.

Previously, the $0.0014 price level served as a strong support, holding up the market. However, after the market failed to maintain this level, the bears converted it into a resistance, adding significant pressure on the bulls’ position and making their recovery efforts more challenging.

Key Levels

  • Resistance: $0.0018, $0.0019, and $0.0020
  • Support: $0.001, $0.0009 and $0.0008

Tamadoge (TAMA/USD): The Bullish Resurgence Still Facing a Key Test

TAMA/USD Price Analysis: The Indicators’ Point of View

In the short term, the following key levels are worth monitoring for a potential bounce: $0.0013, $0.00125, and $0.0012. Currently, the TAMA/USD market is holding its ground at $0.0013, with the bulls actively defending this level.

Investors are likely watching closely to see the outcome of the ongoing struggle between buyers and sellers below the critical $0.0014 resistance level. Meanwhile, the Bollinger Bands indicator reflects a sideways consolidation, signaling that the market remains range-bound. The overall market direction has not yet shifted enough to suggest that the bears have gained definitive control.

Tamadoge (TAMA/USD): The Bullish Resurgence Still Facing a Key Test

Tamadoge Short-Term Outlook: 1-Hour Chart

Zooming into a smaller timeframe perspective, the bulls appear to be signaling a potential upward reversal, as evidenced by their repeated rejections of bearish pressure around the $0.0013 support level in recent sessions. However, they are currently facing resistance at the $0.0014 price level.

A sustained breakout above this critical level would indicate that the market is primed for upward momentum, with the next likely target being the $0.0016 price level.

Buy TAMA today!

Lucky Block (LBLOCK/USD) Market Maintains Bullish Momentum Amid Key Support Zones

Lucky Block Price Forecast – December 16

The LBLOCK/USD market maintains bullish momentum amid key support zones. The price is likely to retract upward as it hits the $0.00001600 support.
 
The technical indicators on the LBLOCKUSD pair signal bullish sentiment. The 9-period Simple Moving Average (SMA) at $0.00001910 currently serves as a dynamic resistance, with the price consolidating just below this level. Meanwhile, the Stochastic Oscillator reflects an oversold condition, with the %K line at 10.57 crossing slightly below the %D line at 22.61, indicating a potential reversal as buying momentum builds. This setup suggests the bulls might soon regain control if buying pressure increases. 

LBLOCK/USD Market Key Levels:

Resistance levels: $0.00002490, $0.00002990, $0.00003500
Support levels: $0.00001880, $0.00001600, $0.00001000

LBLOCK/USD – Daily Chart

The daily chart for LBLOCK/USD shows that a bullish trend is impending as the market becomes oversold.

Examining the price action, LBLOCKUSD has successfully found support around the $0.00001600 mark, forming a recent higher low after a bounce from this level. The price previously broke through a high (BSL) before retracing, maintaining the higher highs and lows typical of a bullish trend.

Key resistance lies near $0.00002350, where sellers previously capped upward moves. If the current support holds, the price could move toward this critical level once again.

Lucky Block (LBLOCK/USD) Market Maintains Bullish Momentum Amid Key Support Zones

What is expected of Lucky Block in the coming days?

Looking forward, projections suggest LBLOCKUSD may sustain its bullish direction in the short to medium term. If the price rebounds from the $0.00001600 support level, a break above the $0.00001910 SMA will confirm upward momentum.

Bulls will then aim for the $0.00002350 resistance and, subsequently, the psychological level of $0.00002490. Should these levels be breached, the next target will be $0.00002990, signaling a strong continuation of the bullish trend.

Lucky Block (LBLOCK/USD) Market Maintains Bullish Momentum Amid Key Support Zones

LBLOCK/USD – Four-Hour Chart

LBLOCKUSD is holding above key support at $0.00001600, maintaining its bullish structure despite recent pullbacks. The 9-period SMA at $0.00001890 aligns with resistance, and a break above this level could fuel momentum toward $0.00002350.

The Fibonacci retracement highlights $0.00001960 (50% level) as a critical short-term target, reinforcing upside potential. The Stochastic Oscillator below 20.0 reflects oversold conditions, indicating a strong possibility of a price reversal upward.

Lucky Block (LBLOCK) Current Statistics
The current price: $0.00001690
Market Capitalization: $1,350,000
Trading Volume: $5,510

Do you need a coin that will 100X soon? Get LBLOCK here

Decentraland (MANA/USD) Anticipates Bearish Trend

Price Analysis: MANAUSD Experiences Bearish Rejection Off the $0.8270 Leading to The Current Bearish Decline

In early March 2024, MANA/USD experienced a significant bearish decline, reaching the $0.2430 support level. At this point, price action reversed into a bullish rally, pushing slightly above the $0.8270 level. However, this upward movement lacked strength and was met with immediate bearish rejection, leading to renewed downward momentum.

MANA/USD Key Levels

Demand Levels: $0.5000, $0.3770
Supply Levels: $0.6250, $0.8270

Decentraland (MANA/USD) Anticipates Bearish Trend

On the 4-hour timeframe, price action formed a bullish head-and-shoulders pattern, typically signaling a bearish reversal. True to this pattern, the market resumed its bearish trend, aligning with the broader sentiment.

Technical indicators further validate the bearish outlook. On the daily chart, price is trading below the Moving Average, a clear signal of continued bearish momentum. Additionally, the Relative Strength Index (RSI) on the daily timeframe shows declining momentum, which reinforces the probability of further downside movement.

While the 4-hour RSI shows a slight rise in momentum, this is not sufficient to suggest a bullish reversal. Instead, it appears to be a minor retracement within the broader bearish structure.

Decentraland (MANA/USD) Anticipates Bearish Trend

Market Expectation

The price action in early March highlights a dominant bearish sentiment, confirmed by both technical patterns and indicators. While slight upward corrections may occur, the overall trend remains bearish unless price sustains a break above key resistance levels.

You can purchase Lucky Block here.  Buy LBLOCK

Note: Cryptosignals.org is not a financial advisor. Do your research before investing your funds in any financial asset or presented product or event. We are not responsible for your investing results