The SPONGE/USD pair has recently shown a resurgence in bullish momentum, rebounding from the critical $0.000006 support level. Since then, the crypto signal has consistently formed higher lows, with the current support level established at $0.000034. While volatility remains elevated, indicating potential for significant price swings, buyers have successfully defended the $0.000034 support, signaling their intent to push prices higher.
Key Market Dynamics:
- Resistance Levels: $0.00005, $0.000055, $0.000060
- Support Levels: $0.000020, $0.0000195, $0.000019
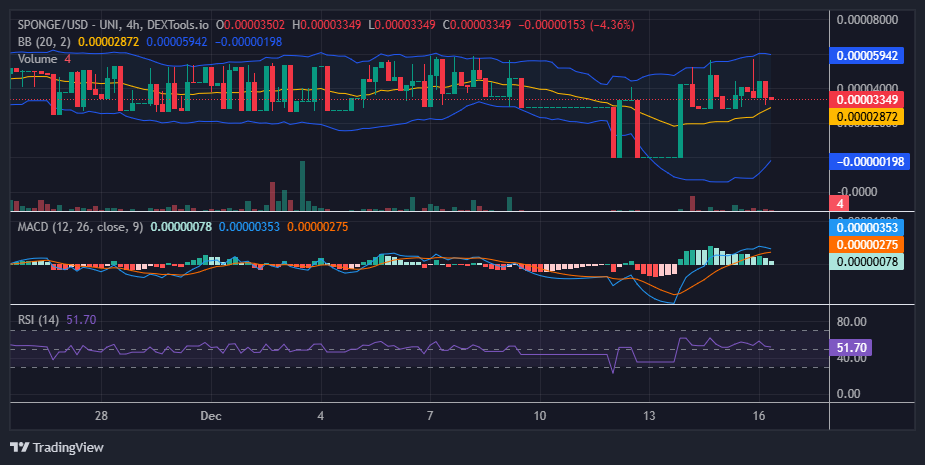
$SPONGE (SPONGE/USD) Technical Outlook
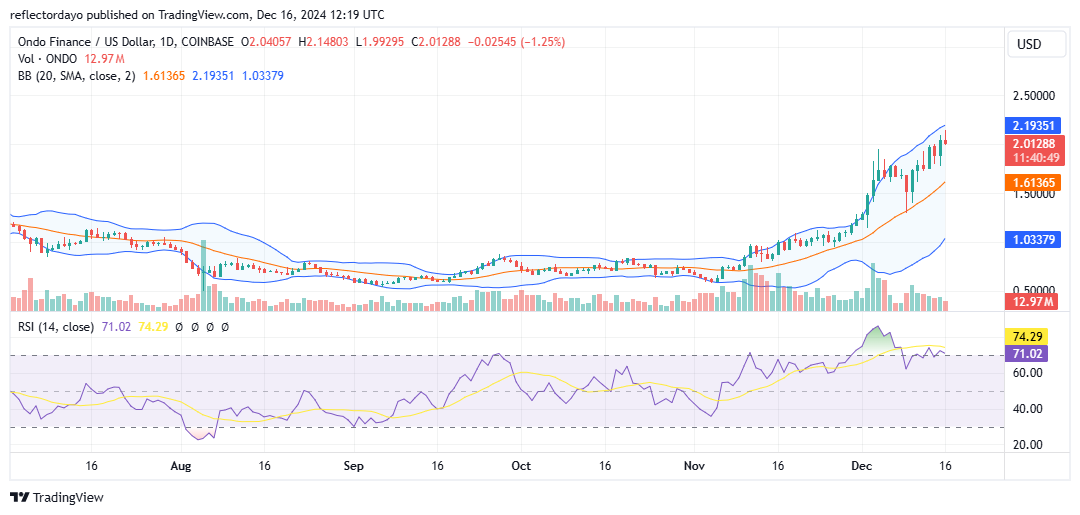
The Bollinger Bands indicator reflects the market’s recent volatility, with a wide band signifying significant price swings. However, the SPONGE/USD market has shown signs of consolidation around the $0.00003 support level. The resistance level at $0.000048 has capped upward movement, resulting in a sideways trend.
A bullish breakout above the $0.000048 resistance could propel the price towards the $0.00006 level. Conversely, a breakdown below the $0.000034 support could lead to further downside.
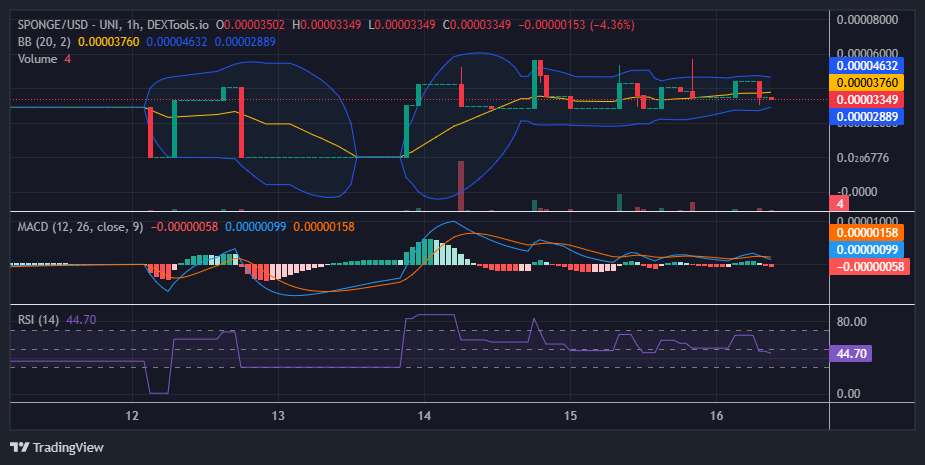
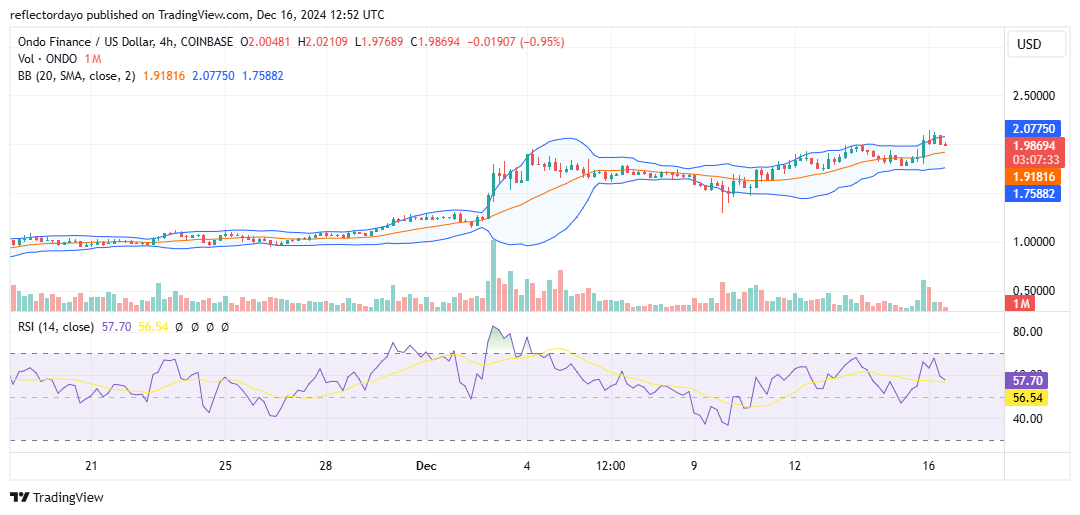
$SPONGE 1-Hour Chart Insights
The 1-hour chart reveals a narrowing Bollinger Band, indicating a potential period of consolidation before a significant price move. A breakout from this range could trigger a strong upward or downward movement. Traders should closely monitor price action and be prepared to capitalize on any significant breakouts.
Buy $SPONGE!
Finance bros 🤝 Crypto bros
what world are we living in? 💦💦 pic.twitter.com/8rqCnr3xkG
— $SPONGE (@spongeoneth) December 15, 2024
Join the SPONGE community and be part of the next big crypto sensation! Buy Sponge ($SPONGE) today!