Tamadoge (TAMAUSD) Bull Market on the Trail of the $0.01200 Price Level

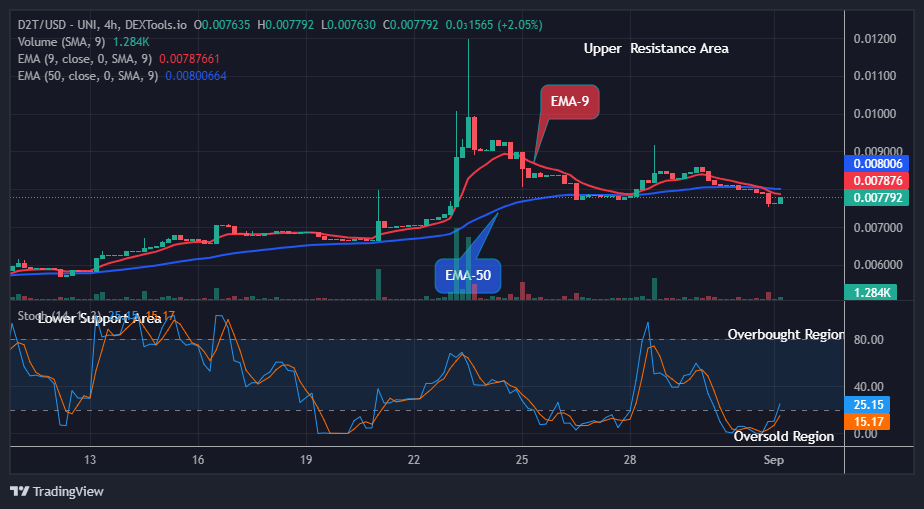
Finally, the Tamadoge bull market appears to be gaining control of the critical $0.0100 price level, signaling a promising start to the new month for the bulls. In yesterday’s market, bulls found support at $0.0094 and pushed the price up to $0.012 before profit-taking began.

With a new support level now established above $0.0100, the bull market is firmly on track, with $0.011 as the next battleground where demand and supply will contend.

Key Levels         

  • Resistance: $0.014, $0.015, and $0.016.
  • Support: $0.010, $0.0091, and $0.0087.

Tamadoge (TAMAUSD) Bull Market on the Trail of the $0.01200 Price Level

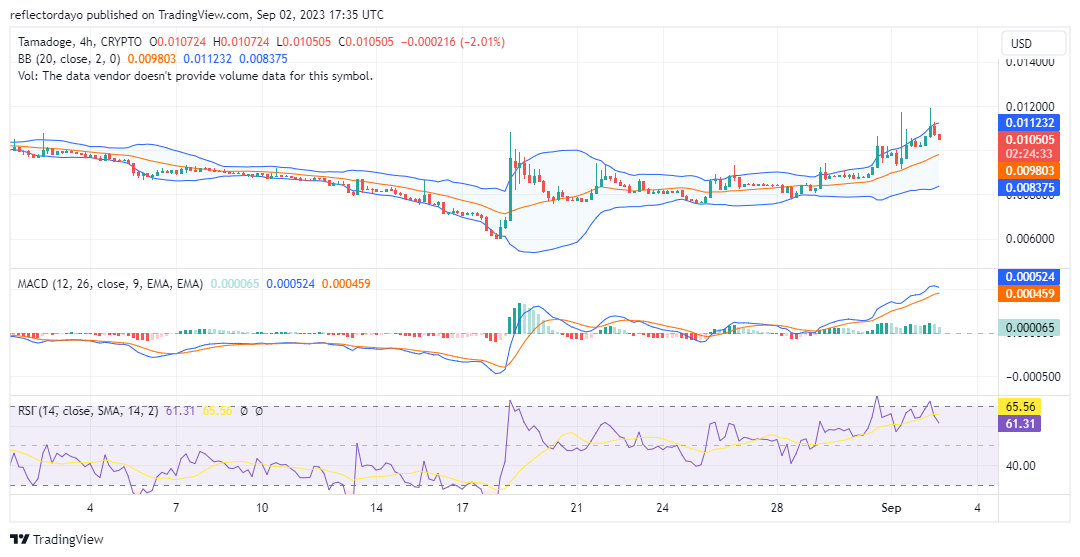
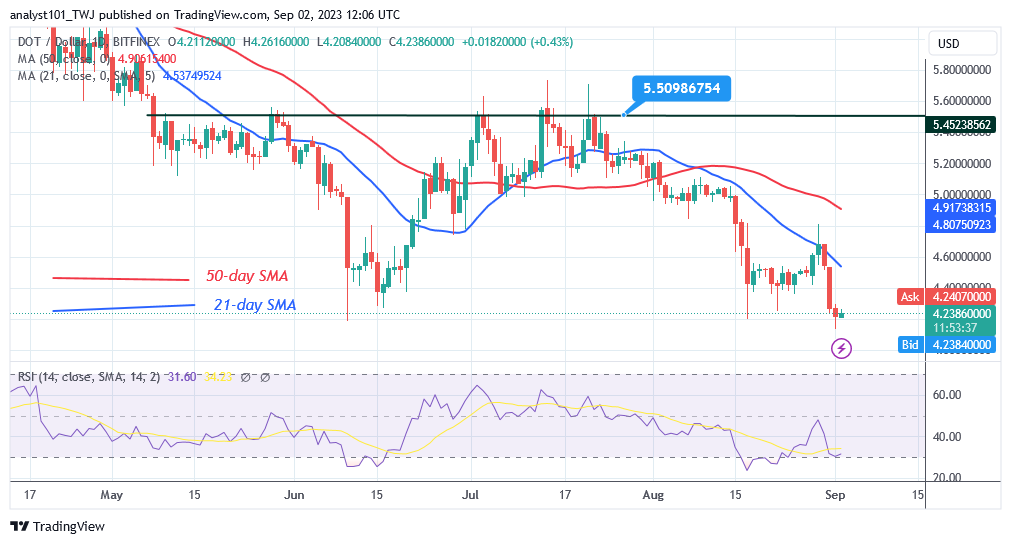
TAMAUSD Price Analysis: The Indicators’ Point of View

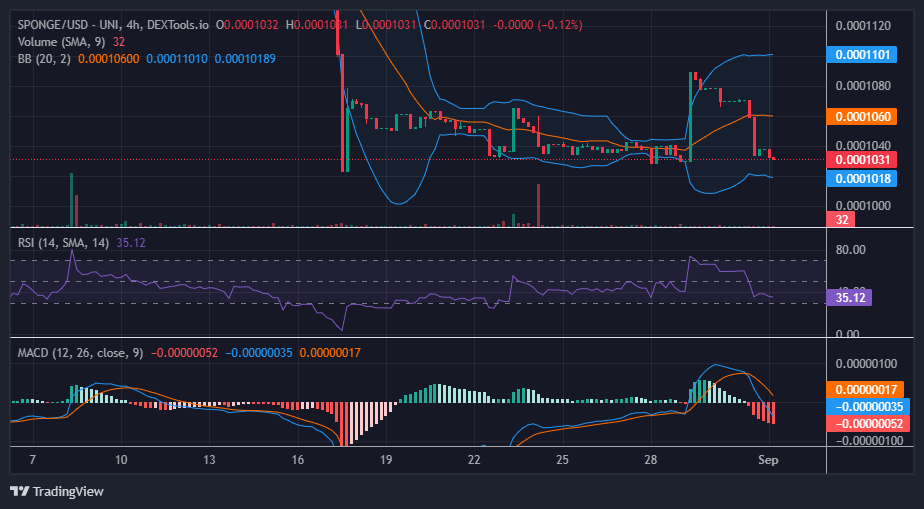
As the TAMAUSD bulls secure the $0.0100 price level, the bears are regrouping around $0.01100, despite the bull market testing levels near $0.012. Nevertheless, the indicators are signaling a strong buying opportunity. The Bollinger Bands now depict an upward-trending market, with the standard deviations moving further apart.

From the perspective of the Relative Strength Index (RSI), the price correction from oversold territory has caused a drop in market momentum. Currently, momentum stands at 61. It would be gratifying for the bulls to discover stronger support around the current price level. However, failing to do so may leave $0.010 as their last line of defense.

Tamadoge (TAMAUSD) Bull Market on the Trail of the $0.01200 Price Level
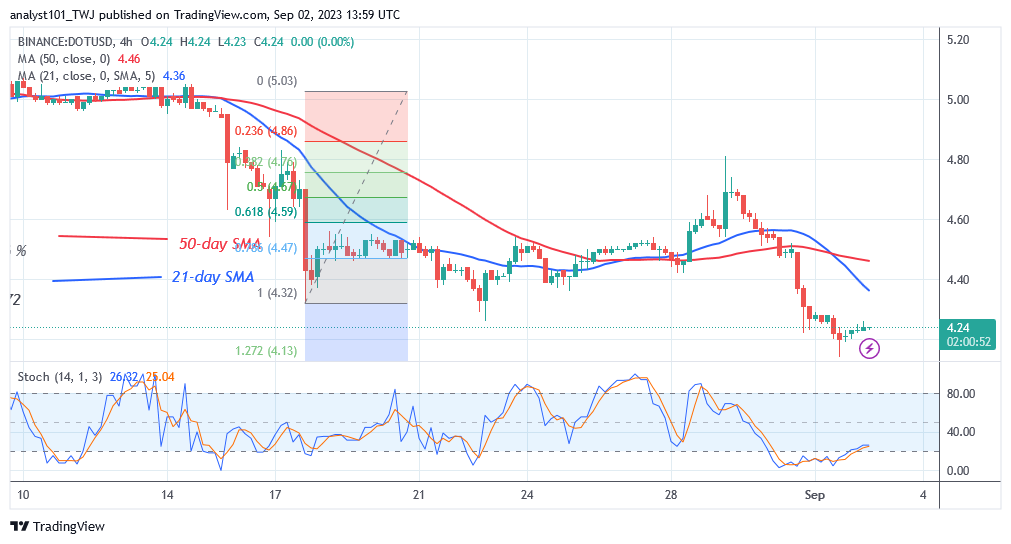
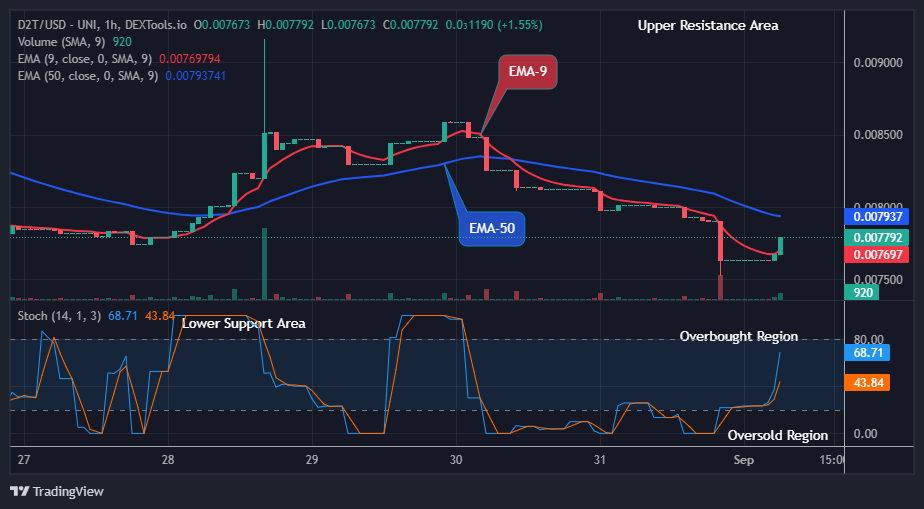
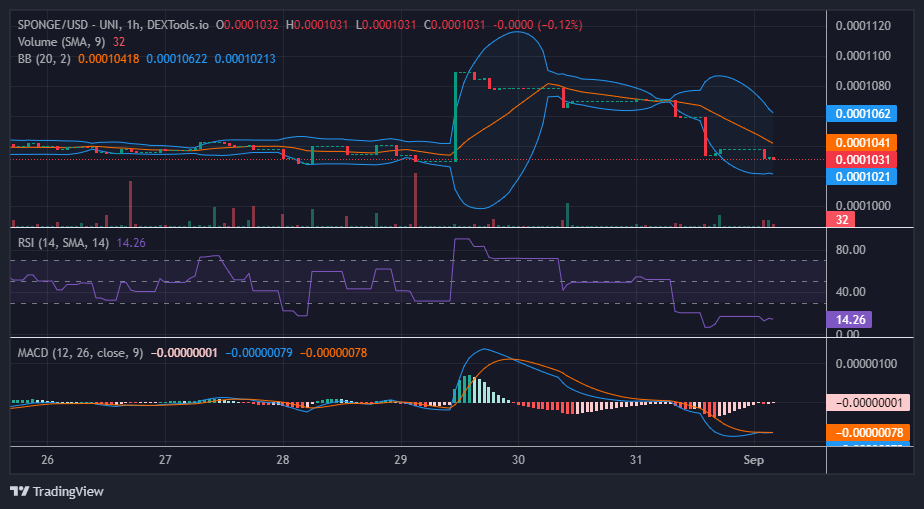
Tamadoge Short-Term Outlook: 1-Hour Chart

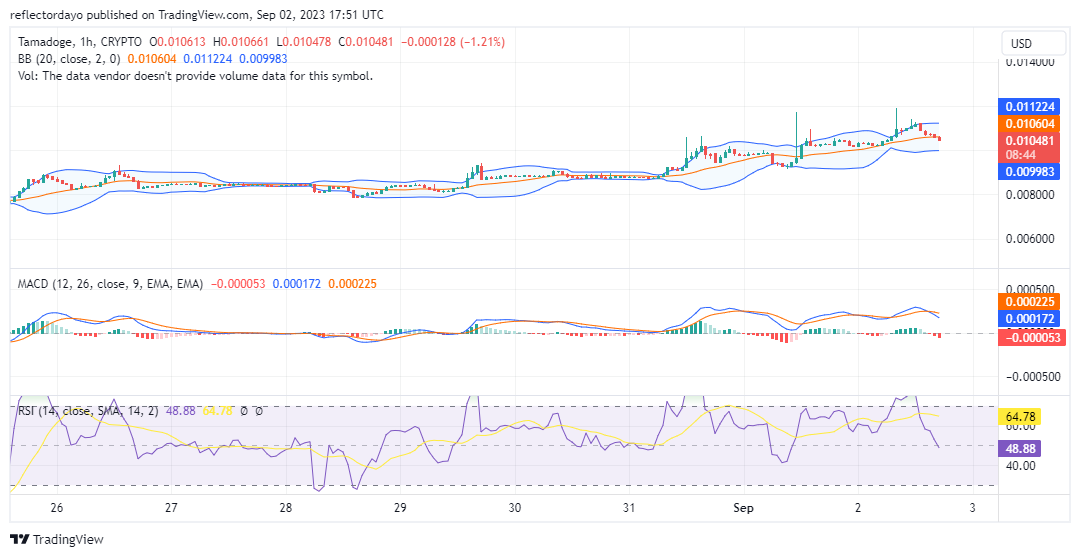
From a 1-hour perspective, it appears that a range-bound market scenario is becoming increasingly probable. This is due to the potential formation of a support level around the 20-day moving average. In this context, the current price represents an equilibrium point. If a period of low volatility ensues, it could lead to a breakout, probably in the upward direction, for the market.

Playing Tamadoge Arcade or Tamadoge Arena can earn you some $TAMA.

Do you want a coin that will be 100 times more valuable in the next few months? That is Tamadoge. Buy TAMA today!

Polkadot Recoups above $4.20 As It Indicates a Likely Bounce

Polkadot (DOT) Long-Term Analysis: Bearish
Polkadot’s (DOT) price movement has been constrained below the moving average lines as it indicates a likely bounce. The moving average lines are limiting the upward movement. The resistance at $4.80 and the 21-day SMA denied the rally on August 29.On the plus side, the bears are active at higher price levels.

Following the rejection at $4.80, the DOT price has dropped to a low of $4.13. If the current support holds, the crypto asset will be forced to move in a band between $4.20 and $4.80. The altcoin has dropped and is now trading in the market’s oversold zone. Long candlestick tails indicate substantial buying at lower prices.

Polkadot Recoups above $4.20 As It Indicates a Likely Bounce
DOT/USD – Daily Chart

Technical indicators:
Major Resistance Levels – $10, $12, $14
Major Support Levels – $8, $6, $4

Polkadot (DOT) Indicator Analysis
Polkadot has dropped to the Relative Strength Index level of 32 for period 14. As a result of the recent rejection, the altcoin is in a bearish trend zone. The current decline in the value of the crypto is caused by the price bars being below the moving average lines. When price bars continue above the moving average lines, the altcoin will rise.

The cryptocurrency is surging after reaching the market’s oversold zone. It is higher than the daily Stochastic level of 25.

What Is the Next Direction for Polkadot (DOT)?
Polkadot is rising after returning to its prior low of $4.20 as it indicates a likely bounce. Bulls pounced when the market hit a low of $4.13. The market will continue to be in range-bound move as long as the range bound levels hold. Polkadot should have reversed in the market’s oversold area. The predicted price range for the altcoin is $4.20 to $4.80.

Polkadot Recoups above $4.20 As It Indicates a Likely Bounce
DOT/USD – 4 Hour Chart

You can purchase Lucky Block here. Buy LBLOCK

Note: Cryptosignals.org is not a financial advisor. Do your research before investing your funds in any financial asset or presented product or event. We are not responsible for your investing results

Dash 2 Trade Price Predictions for Today, September 2: D2TUSD Price Hints Fresh Recovery at the $0.00779 Supply Mark

Dash 2 Trade Price Forecast: D2TUSD Price Hints Fresh Recovery at the $0.00779 Supply Mark (September 2)
In response to recent volatility in the crypto market, Dash 2 Trade price shows a minor relief rally as the bearish sentiment begins to fade away. This fresh upward movement is driven by the high demand of the long traders. The coin is possibly making its way up after hitting the $0.00763 high level to signal a pump. Thus, a strong push from the current price at the $0.00779 supply value will put the crypto in a bullish trend and this may further extend to the $0.1000 upper resistance level resulting in intraday gains for the buy traders.

Key Levels:
Resistance levels: $0.01000, $0.01100, $0.01200
Support levels: $0.00900, $0.00800, $0.00700

D2T (USD) Long-term Trend: Bearish (4H)
D2TUSD indicates a downward trend with a bearish sentiment in its long-term perspective. The coin is trading below the two EMAs. However, the current trend will soon be nullified as the market has now resumed its bullish race to the overhead resistance.
Dash 2 Trade Price Predictions for Today, September 2: D2TUSD Price Hints Fresh Recovery at the $0.00779 Supply Mark
The sustained pressure from the short traders at a $0.00752 low level in the past action has contributed to its bearishness in its recent low.

A rise to a $0.00779 high level by the long traders shortly after the 4-hour chart opens today affirms the returns of the buy traders into the market.

Thus, the price of Dash 2 Trade is set to advance further if the bulls can redouble their efforts and push above the current supply level.

However, with sustained buying, the market price of D2TUSD may rechallenge another resistance zone of $0.01197 soon, indicating the buyers’ attempt to prolong the bullish rally.

Additionally, the market is now pointing up below the 20% range of the daily stochastic. This means the crypto market is oversold and the emergence of the bulls is crucial at this moment.

Hence, buyers are expected to turn around the price of Dash 2 Trade and may likely reach the $0.10000 supply value in the days ahead in its higher time frame.

D2T (USD) Medium-term Trend: Bullish (1H)
Dash 2 Trade remains bullish on the medium-term time frame. This is clear as we can see the prices trading above the EMA-9.
Dash 2 Trade Price Predictions for Today, September 2: D2TUSD Price Hints Fresh Recovery at the $0.00779 Supply Mark
The sustained bullish pressure pushed the currency pair up to the $0.00763 supply level during yesterday’s session and sustained it. This has made it possible for the D2TUSD price to remain in an uptrend at its recent high.

Amid the recent growth in the crypto market, the Dash 2 Trade buyers provided a bullish breakout to a $0.00779 high mark above the EMA-9, paving the way for further recovery in the near future.

Hence, this current level acts as a strong resistance for a good entry point, therefore, if the price jumps above the $0.00916 previous supply value, buyers may gain better confirmation for further recovery.

Adding to that, further downsides are unlikely as the market price of D2TUSD is showing an uptrend on the daily signal. The coin is expected to continue the bullish trend pattern, so we can now grow in confidence that a potential buy is coming near. If this is achieved, a $0.10000 high value might be the target in the coming days in its medium-term outlook.

Do you have a crypto trading plan? What if you could gauge its success by doing three years’ worth of trade with it in just two minutes?

You can do it using the back tester in Dash 2 Trade!


Want a coin that has a huge potential for massive returns? That coin is Dash 2 Trade. Buy D2T now.

Compound (COMPUSD) Keeps Declining Algorithmically Since Price Rejection At $86.00 Resistance

COMPUSD Analysis: The Market Keeps Declining Algorithmically Since Price Rejection At $86.00 Resistance

COMPUSD has kept declining algorithmically since price rejection at $86.00 resistance. Following an exuberant expansion to the upside all through June and July 2023, COMPUSD hit $86.00. The upsurge to the $86.00 resistance was followed by the collapse of COMPUSD as the bears took complete control of the market.

COMPUSD Significant Zones
Demand Zones: $23.20, $3.00
Supply Zones: $54.60, $86.00

TradingView Chart

The market’s descent from the $54.60 resistance plunged the price into the oversold region in June 2023. The state of the market being oversold was revealed by the RSI (Relative Strength Index), as it coincidentally crossed the 30.0 level to the downside. Following the indication of an oversold state, the price rose spontaneously and broke through the $54.60 resistance until COMPUSD became overbought. Before the indication of the market’s overbought state, the price retraced downward to retest the $54.60 level before continuing its uptrend.

In the overbought state, the year’s high formed on July 16, 2023. The market collapsed immediately after the formation of the major high at $86.00 resistance, forming a swing low at $58.30. Following the formation of the low, COMPUSD surged upward only to form a lower high after a buy-side liquidity sweep above $77.30. As the market structure shifted to the downside, the MA Cross gave a sell signal, indicating the bears’ presence in the market. The decline continued algorithmically, invalidating old lows until the formation of a new low at $35.40.

TradingView Chart

Market Expectation

The market’s overall trend is bearish; however, COMPUSD is currently in a consolidation phase on the four-hour chart. The consolidation began after the formation of the swing low of $35.40 at the discount zone. Investors takeaway; COMPUSD is likely to retrace first to the upside before the market’s overall trend is resumed.

Learn How to Day Trade Crypto

You can purchase Lucky Block here. Buy LBLOCK

NoteCryptosignals.org  is not a financial advisor. Do your research before investing your funds in any financial asset or presented product or event. We are not responsible for your investing results.

Shiba Inu (SHIBUSD) Plunges Lower As Price Flips Bearish From An Overbought Region

SHIBUSD Analysis: Market Plunges Lower As Price Flips Bearish From An Overbought Region

SHIBUSD plunges lower as the price goes bearish from an overbought region. Following the bearish divergence that was revealed by the RSI (Relative Strength Index), SHIBUSD crashed massively to the downside. The overall market trend has been bearish since the beginning of the year 2023. Until a major flip to the upside occurs, SHIBUSD is likely to remain bearish for a long time.

SHIBUSD Significant Zones
Demand Zones: $0.00000700, $0.00000600
Supply Zones: $0.00001190, $0.00001590

Shiba Inu (SHIBUSD) Plunges Lower As Price Flips Bearish From An Overbought Region

At $0.00001590, the market plunged aggressively under the selling pressure from the premium zone. Due to the selling pressure, SHIBUSD failed to form a higher high above the $0.00001590 price level. A lower high formed at $0.00001400 as the price veered downward again. The massive descent that ensued after the formation of the lower high at $0.00001400 sank the price below the previous support of $0.00001190. The breakout through the previous support of $0.00001190 caused a market structure shift to the downside. The market structure shift to the downside implied that the market was now completely under the control of the bears.

Following a short-term retracement at $0.0000970, SHIBUSD hit $0.00001190 and crashed further to the downside. The downtrend continued into the $0.00000600 demand zone before making a significant correction to the upside. The upward correction extended beyond the previous highs until the price entered a premium range. According to the RSI indicator, a bearish divergence ensued as the price formed a higher high in an overbought region. The bearish trend has resumed as the weak low at $0.00000880 was invalidated on August 17, 2023.

Shiba Inu (SHIBUSD) Plunges Lower As Price Flips Bearish From An Overbought Region

Market Expectation

The invalidation of the $0.00000880 low caused a Change Of Character (CHOCH) to the downside on the four-hour chart. The CHOCH was followed by a liquidity sweep below the Equal Low (EQL) at $0.00000810. For investors, SHIBUSD is expected to continue its bearish trend once the price hits the breaker block at $0.00000880.

Learn How to Day Trade Crypto

You can purchase Lucky Block here. Buy LBLOCK

NoteCryptosignals.org  is not a financial advisor. Do your research before investing your funds in any financial asset or presented product or event. We are not responsible for your investing results.

ApeCoin (APEUSD) Poised for Bullish Retracement as Selling Pressure Eases

APEUSD Analysis: Market Sets To Make A Bullish Retracement As Selling Pressure Reduces

APEUSD is set to make a bullish retracement as selling pressure reduces. The momentum of the bearish market began to decrease as APEUSD entered the oversold region in June 2023. As of now, the current trading range lies between $2.120 and $1.350. A pullback to the upside is likely possible as the price struggles to keep declining.

APEUSD Significant Zones
Demand Zones: $1.350, $0.580
Supply Zones: $3.370, $4.750

ApeCoin (APEUSD) Poised for Bullish Retracement as Selling Pressure Eases

The previous trend of APEUSD was a bullish trend before the change of environment in February 2023. The uptrend brought the price to a two-year high of $6.420. After the formation of the major high, the price crashed downward into a fair value gap of around $5.000. The market’s overall trend emerged after the formation of a lower high and a market structure shift. The market structure shift happened as the price crossed below the previous support at $4.750. At $3.630, a lower low formed after the market flipped bearish.

Following a short-term bullish retracement, APEUSD resumed its downtrend after a rejection at the $4.750 resistance. The downtrend continued progressively in fractals until the selling momentum began to decline. The decline in selling momentum was a result of the buying pressure in the oversold region. According to the RSI (Relative Strength Index), the market entered deeply into the oversold region on June 11, 2023. Owing to the indication of the market’s oversold state, a pullback to the upside is highly probable.

ApeCoin (APEUSD) Poised for Bullish Retracement as Selling Pressure Eases

Market Expectation

The market is currently heading upward on the four-hour chart. The bullish expansion was followed by the inability of the price to easily bring it below the $1.350 low. For those willing to trade APEUSD, it is expected to continue skyrocketing until the premium zone of the market’s trading range is reached.

Best Crypto Staking Sites


You can purchase Lucky Block here. Buy LBLOCK

NoteCryptosignals.org is not a financial advisor. Do your research before investing your funds in any financial asset or presented product or event. We are not responsible for your investing results.

SPONGE/USD ($SPONGE) to Bounce Again at the $0.0001030 Price Level

SPONGE/USD has been exhibiting a bearish trend with little change since the previous analysis. The market appears to be retracing towards the starting point of the last bull market, which is at the $0.0001030 price level. Key indicators such as the Relative Strength Index (RSI) and the Moving Average Convergence Divergence (MACD) suggest continued bearish sentiment.

Key Levels

  • Resistance: $0.000115, $0.000120, and $0.000125.
  • Support: $0.00010, $0.000090, and $0.00008.

SPONGE/USD ($SPONGE) to Bounce Again at the $0.0001030 Price Level

Sponge (SPONGE/USD) Price Analysis: The Indicators’ Point of View

With an RSI of 35, SPONGE/USD is currently well in the sell territory and nearing the oversold territory. This suggests that there is selling pressure in the market and that the cryptocurrency may be undervalued. Traders and investors need to pay close attention at this time, watch for signs of reversal, and take advantage of them.

The MACD line is currently below the zero line, indicating a bearish trend. This suggests that selling pressure has been dominating the market and that there is a lack of positive momentum. However, judging by historical market behavior, a price rebound is very likely around here.

SPONGE/USD ($SPONGE) to Bounce Again at the $0.0001030 Price Level

$SPONGE Short-Term Outlook: 1-Hour Chart

SPONGE/USD is currently in a persistent bearish trend, with its price retracing towards the starting point of the previous bull market, which is located at the $0.0001030 level. The Relative Strength Index (RSI) consistently measures below 30, signaling an oversold condition and highlighting the presence of selling pressure. Given the market’s current state, there is a growing probability of a rebound. Presently, the price is consolidating around a significant support level, further enhancing the potential for an imminent market rally.

Do not pass up the chance to interact with $SPONGE on @bitgetglobal.

Invest in the hottest and best meme coin. Buy Sponge ($SPONGE) today!

Solana (SOL/USD) Market Is Dipping, Garnering a Bouncing Sign

Solana Price Prediction – September 1
The present southerly movement pace in the trade transactions of SOL/USD has been observed sipping and trying to breach past the logical lower-trading point of $20 as the crypto’s price is garnering a bouncing sign in the process along the line.

Even though the price is in a falling configuration, it is anticipated that this will only be a temporary situation because the price may just begin a completion course that won’t go below the $18 support level. The market’s bottom point as of this technical analysis is $19.70, with a minute average percentage rate of 0.56 positive.

SOL/USD Market
Key Levels:.
Resistance levels:$22, $24, $26
Support levels: $18, $16, $14

SOL/USD – Daily Chart
The SOL/USD daily chart showcases that the crypto market is dipping against the psychological point of $20, garnering a bouncing sign from around it.

Around the $22 resistance line, there has been a slight twitch of the larger moving average by the smaller moving average from the topside. The stochastic oscillators have crossed southward from 54.17 to 37.72 as a result of the mildly decreasing events. That suggests that bears are probably making their way toward the finish line shortly.
Solana (SOL/USD) Market Is Dipping, Garnering a Bouncing Sign
What could traders expect when the SOL/USD market is open and trading around the $20 mark?
A falling condition has been made around the $20 psychological line in the transactions involving Solana and the US coin, given that the crypto market is currently dipping and garnering a bouncing sign.

As things stand, buyers would need to exercise caution when entering the market because the stochastic oscillators have not been repositioned. Leaving that aside, if a bullish candlestick forms with its bottom centered around the price of $20, it will be sufficient to make a long position order if it does so prior to the oscillators moving upward at a specific time.

Pushers of short-term short positions may take a chance by opening sell orders at $20 when vigorous falling forces are visible, with hefty stop-loss orders executed near the resistance of $22. On the other hand, investors shouldn’t experiment with panic sales tactics.
Solana (SOL/USD) Market Is Dipping, Garnering a Bouncing Sign
SOL/BTC Price Analysis
In contrast, Solana is range-bound, dipping slightly against the trending gravity of Bitcoin, garnering a bouncing sign with higher sideways trading channels.

The 50-day SMA trend line and the 14-day SMA trend line have both momentarily bent southward. The stochastic oscillators maintain values between 5.32 and 0.85 because they are oversold. To invalidate the remaining potential drops between the two cryptos and give bulls a reliable point of entry going forward, a circumstance must create a bullish candlestick.

Note: Cryptosignals.org is not a financial advisor. Do your research before investing your funds in any financial asset or presented product or event. We are not responsible for your investing results.

You can purchase Lucky Block here. Buy LBLOCK

Ripple Unlocks 1 Billion XRP Tokens to Start the Month

In a strategic move aimed at bolstering XRP liquidity and advancing its role in cross-border payments, Ripple, the driving force behind the XRP cryptocurrency, has unlocked one billion XRP tokens from its escrow account. Valued at approximately $153 million, this release unfolded in four stages on September 1, as reported by Whale Alert, a prominent cryptocurrency transaction tracker.

The first batch comprised 300 million XRP, followed by three subsequent releases of 100 million, 200 million, and 400 million XRP, respectively, resulting in a total worth surpassing $500 million.

Screenshot of Ripple transactions from X
Image Source: X

In a notable post-release development, a significant XRP holder, colloquially referred to as a “whale,” swiftly transferred 20 million XRP, worth over $10 million, to the Binance exchange. This move has raised speculation regarding potential token liquidations or exchanges.

Nevertheless, Ripple’s established practice involves re-escrowing most of the unlocked funds within days. This approach is designed to ensure the stability of XRP prices and support their On-Demand Liquidity (ODL) service. ODL leverages XRP to facilitate rapid and cost-effective cross-border payments for financial institutions.

The Unlocking of XRP Comes Amid Ripple vs. SEC Lawsuit

The timing of this XRP release coincides with Ripple’s ongoing legal skirmish with the U.S. Securities and Exchange Commission (SEC). The SEC alleges that Ripple unlawfully marketed unregistered securities. Recent court developments have favored Ripple, with a judge rejecting the SEC’s request for access to the company’s legal communications.

Looking ahead, Ripple CEO Brad Garlinghouse has announced a celebration event in New York City on September 29, marking the company’s legal victories. The XRP community is eagerly anticipating further updates from Ripple, recognizing the lawsuit’s potential ramifications for both XRP and the broader cryptocurrency landscape.

Ripple’s move to unlock XRP, despite the ongoing legal battle, reflects its commitment to the digital asset’s growth and utility, not only in the realm of cross-border payments but also as a key player in the ever-evolving cryptocurrency ecosystem.


Interested in learning how to day trade crypto? Get all the information you need here