ApeCoin (APEUSD) Indicates Bullishness with Consolidation at $1.060

APEUSD Analysis – Market Shows Signs Of Bullishness As Price Consolidates At $1.060 Support

APEUSD indicates bullishness as the price consolidates at $1.060 support. While the overall trend of the market is still bearish, the market poses an upward move as it consolidates at $1.060 support. Also, according to the RSI (Relative Strength Index), the APE/USD market is already oversold. Owing to the oversold indication, a bullish retracement or complete reversal might occur.

APEUSD Significant Zones
Demand Zones: $1.060, $0.580
Supply Zones: $2.610, $4.750

ApeCoin (APEUSD) Indicates Bullishness with Consolidation at $1.060

The emerging downtrend from the premium zone brought the price to $3.630. At the $3.630 price level, a low was formed as APEUSD made a bullish retracement due to the oversold state of the market. According to the RSI indicator, a recovery phase has set in, causing a pullback to the upside. The pullback ended at $4.860, after which a lower low formed at $4.750. The downtrend resumed afterward, and APEUSD declined with increasing momentum, breaking all support levels to the downside.

The major swing low of $3.630 was invalidated as the intensity of the bearish move increased. Further decline brought the price below the $2.610 previous support as a bearish marubozu candlestick formed in the process. After the breakout below the $2.610 previous support, APEUSD converged within a bearish channel. At first, a high formed at $2.420, after which another high formed at $2.330. At this moment, a pullback to the upside is likely, as the RSI indicator shows that the market is extremely oversold.

ApeCoin (APEUSD) Indicates Bullishness with Consolidation at $1.060

Market Expectation

The previous trading range of APEUSD on the four-hour chart was broken at the beginning of this month. This happened as the selling pressure overwhelmed the market in the premium zone. However, the market’s direction is now set to flip bullish as CHoCH (Change of Character) occurred after a bounce off the $1.060 support.


You can purchase Lucky Block here. Buy LBLOCK

NoteCryptosignals.org is not a financial advisor. Do your research before investing your funds in any financial asset or presented product or event. We are not responsible for your investing results.

Decentraland (MANAUSD) Remains Bearish As Buyers Exit The Market At Diagonal Resistance

MANAUSD Analysis: The Market Remains Bearish As Buyers Exit The Market At Diagonal Resistance

MANAUSD remains bearish as buyers exit the market at the diagonal resistance. The buying momentum of the market fails to increase despite the ongoing recovery phase from the oversold state. As per the RSI (Relative Strength Index), the market was in an oversold state as of last week. However, MANA/USD market participants remain pessimistic as the price fails to invalidate major resistance levels.

MANAUSD Significant Zones
Demand Zones: $0.3060, $0.1880
Supply Zones: $0.4350, $0.7000

Decentraland (MANAUSD) Remains Bearish As Buyers Exit The Market At Diagonal Resistance

The price rejection from the $0.7000 demand zone brought the price rapidly into an oversold state. Following a significant displacement to the downside, MANAUSD aggressively declined without a significant retracement until it formed a low at $0.4350. The formation of the low eventually led to a significant retracement, which ended after a month. Due to the market’s overall direction, the downtrend resumed. According to the MA Cross, the market’s trend was bearish. Owing to the decline in the premium zone, the crash extended into the demand zone at $0.3060.

Learn How to Day Trade Crypto

At the $0.3060 demand zone, another significant retracement ensued, bringing the price back to the $0.4350 level. After the retracement, which lasted for more than a month, the market flipped back to its bearish move. The downtrend continued along the major trendline until the support at $0.3060 failed to push the price upward. After the formation of a weak high at $0.3020, which was below the $0.3060 support, the market crashed downward. A buy-side liquidity grab has occurred above the $0.3020 weak high, and MANAUSD will likely resume its downtrend from here.

Decentraland (MANAUSD) Remains Bearish As Buyers Exit The Market At Diagonal Resistance

MANA/USD Market Expectation

On August 31, 2023, as the market experienced a decline, a bearish order block formed below $0.3060, indicating a break in structure. This four-hour bearish order block emerged. Following the break of structure at the $0.2750 low, MANAUSD surged upward, invalidating the $0.3020 high as it hit the diagonal resistance. After the price enters the bearish order block, MANAUSD is expected to return downward as it resumes its bearish trend.

You can purchase Lucky Block here. Buy LBLOCK

NoteCryptosignals.org is not a financial advisor. Do your research before investing your funds in any financial asset or presented product or event. We are not responsible for your investing results.

Lucky Block Price Prediction: LBLOCK/USD Sets to Trade above $0.000100 Level

Lucky Block Price Prediction – September 19

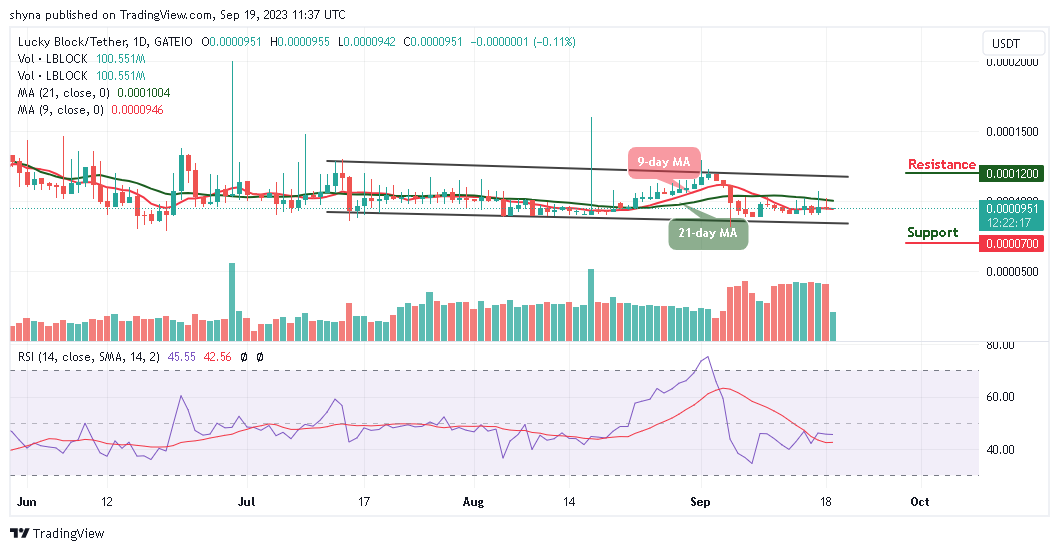
The Lucky Block price prediction shows that LBLOCK is poised to maintain its current sideways trajectory, remaining close to the moving averages.

LBLOCK/USD Long-term Trend: Ranging (1D Chart)

Key Levels:

Resistance levels: $0.000120, $0.000130, $0.000140

Support levels: $0.000070, $0.000060, $0.000050

Lucky Block Price Prediction: LBLOCK/USD Sets to Trade above $0.000100 Level
LBLOCKUSD – Daily Chart

LBLOCK/USD is currently trading in a range defined by the 9-day and 21-day moving averages. However, this consolidation phase is seen as a precursor to a potential upward surge in the Lucky Block price, leading traders to anticipate a forthcoming rally.

Lucky Block Price Prediction: LBLOCK/USD Could Turn Bullish

As per the daily chart analysis, the next move for Lucky Block’s price is to breach the $0.000100 resistance level. Once achieved, bulls are expected to push above the 21-day moving average, targeting resistance levels at $0.0000120, $0.000130, and $0.000140. Concurrently, the Relative Strength Index (RSI) at 14 periods is poised to cross above the 50-level. However, in the event of a temporary retracement, support levels at $0.000070, $0.000060, and $0.000050 might come into play, offering potential opportunities for new investors to enter the market.

LBLOCK/USD Medium-term Trend: Ranging (4H Chart)

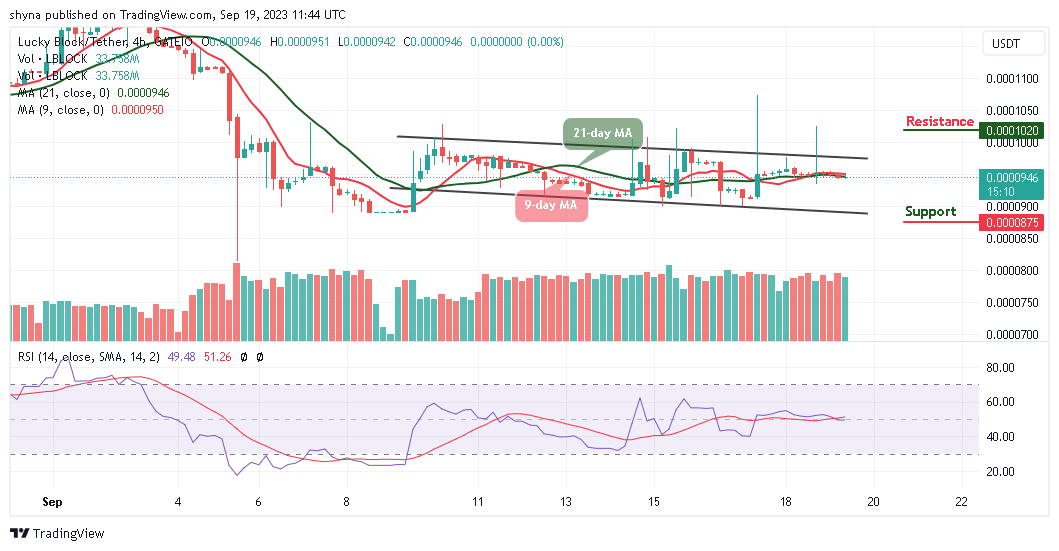
In the 4-hour chart, Lucky Block is currently trading within the 9-day and 21-day moving averages, with the potential to break above the upper boundary of the channel. The Relative Strength Index (RSI) at 14 periods is moving sideways around the 50-level but it could begin to show signs of moving upwards.

Lucky Block Price Prediction: LBLOCK/USD Sets to Trade above $0.000100 Level
LBLOCKUSD – 4 Hour Chart

Nonetheless, should the bulls succeed in pushing the price above the channel, Lucky Block could ascend to the $0.000102 resistance level and above. However, this scenario may not materialize if the 9-day moving average crosses below the 21-day moving average, which could drive the price toward the lower boundary of the channel. Staying within this range could lead the coin to test the $0.000087 support level and below, presenting an opportunity for new buyers to enter the market.

You can purchase Lucky Block here. Buy LBLOCK

Optimism Airdrops $26.7 Million in OP Tokens to Loyal Users

Optimism, the renowned layer-2 scaling network for Ethereum, has distributed a windfall of 19.4 million OP tokens, equivalent to a staggering $26.7 million, to its dedicated user base. The recipients of this impressive airdrop are the 31,879 unique addresses that actively engaged in the network’s governance between January and July 2023.

Eligible users demonstrated their commitment either by delegating OP tokens above a specified threshold or by delegating their voting influence to an address that participated in on-chain voting at least once.

Optimism’s motivation behind this benevolent act was to extend appreciation for their users’ contributions to “positive sum governance participation.” Astonishingly, the beneficiaries of this grand gesture do not need to embark on any arduous claims process; the OP tokens are being seamlessly dispatched to their wallets.

Optimism and Its Frequent Airdrops

This is not Optimism’s first rodeo in showering its community with native tokens. In June 2022, when the protocol inaugurated its mainnet, it doled out a whopping 200 million OP tokens to its early supporters. Fast forward to February 2023, when an additional 11.7 million OP tokens rained down upon users in another airdrop event.

In total, Optimism has earmarked a substantial 19% of its initial token supply for rewarding its devoted community.

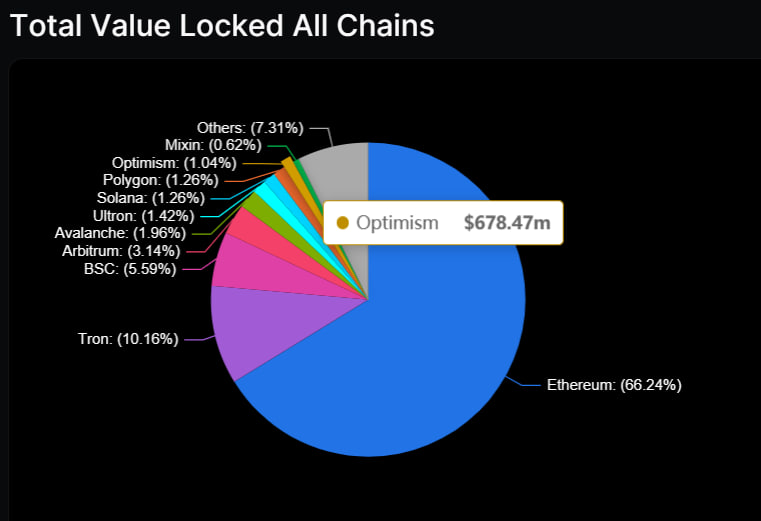
Optimism stands tall as a preeminent layer-2 solution for Ethereum, steadfast in its mission to enhance scalability and alleviate the ever-burgeoning gas fees that often plague the Ethereum network. It accomplishes this by executing transactions off-chain and periodically settling them on the Ethereum main chain. Also, DeFiLlama data shows that Optimism boasts the ninth-largest Total Value Locked (TVL) in the decentralized finance (DeFi) ecosystem, with an impressive $678.47 million fortifying its network.

DeFi TVL in Optimism
Source: DeFiLlama

To empower the developer community, the protocol recently unveiled OP Stack, a versatile developer kit. This toolkit empowers developers to construct their own layer-2 blockchains utilizing the innovative technology pioneered by Optimism. Notable projects that have harnessed the power of OP Stack include Base, a network incubated by Coinbase, and opBNB, a blockchain-backed project by Binance.


Interested In Learning How To Use Leverage While Trading? Find Out Here

What are CryptoPunk NFTs? Why Are They So Expensive?

Introduction of CryptoPunk NFTs

In the world of non-fungible tokens (NFTs), owning a CryptoPunk is considered quite cool. These CryptoPunks are not just status symbols; they are like valuable treasures from the internet’s past. Some people even say they are the most important NFT collection ever.

Crypto Punks NFT are special because they are closely connected to the Ethereum blockchain, which is a big deal in the NFT world. You can think of CryptoPunks as the ancestors of all other NFT projects. Even the really famous ones, like the Bored Ape Yacht Club, can be traced back to CryptoPunks.

To help us understand CryptoPunks better, we talked to a famous NFT collector named Gmoney. He’s a huge fan of CryptoPunks. Let’s dive into the world of Crypto Punk NFT and find out why it’s so expensive.

What are CryptoPunks?

CryptoPunks are a collection of 10,000 special digital characters that live on the Ethereum blockchain. Each character is like a tiny 24×24 pixel portrait with unique features and traits.

CryptoPunks was one of the very first non-fungible token projects. They set the stage for other popular NFT collections like CryptoKitties, Bored Ape Yacht Club, and CrypToadz.

Back in June 2017, you could get a CryptoPunk for free if you had an Ethereum wallet. You just had to pay a small fee to create it. But things changed in 2021, when NFTs became super popular. CryptoPunks became really valuable, and some were sold for millions of dollars. This made some lucky people who got them for free very rich. The rarest CryptoPunks, like the ones that look like aliens, are some of the most expensive digital art pieces ever sold. This helped show that NFTs are a big deal in the art world and in technology.

Cryptopunks come in five categories, from common to super rare: male, female, zombie, ape, and alien. Each CryptoPunk is randomly made with different things like hats, beards, glasses, and earrings.

Unlike many other NFT collections, CryptoPunks uses the ERC-20 standard, which is the same thing cryptocurrencies like MANA and ENJ use. The ERC-721 standard, which was inspired by CryptoPunks, is what most other Ethereum-based collections use now.

Brief History of CryptoPunks

In 2017, two developers from a mobile software company called Larva Labs, based in New York City, created CryptoPunks. Larva Labs is known for making apps for both iOS and Android devices. These developers gave away 9,000 CryptoPunks for free to people, and they kept 1,000 for themselves. The only thing you needed back then to own a CryptoPunk was an Ethereum blockchain. Larva Labs makes money by selling the CryptoPunk NFTs it owns. However, they don’t tell anyone how many CryptoPunk NFTs they have.

How to Buy CryptoPunk NFTs

Buying NFT Crypto Punks is simple. If you’re interested in buying and investing in CryptoPunk NFTs, you can buy Crypto Punk NFT with these easy steps:

Create an OpenSea Account: Begin by opening an account on OpenSea, which is the biggest marketplace for trading NFTs. As of March 2022, there were over 2 million NFTs listed on this platform, ready for trading.

Connect Your Wallet: To use OpenSea, you’ll need to connect your digital wallet. The most commonly used wallet on OpenSea is Metamask. You can add the Metamask extension to your Google Chrome browser, which makes it easy to interact with the site and carry out cryptocurrency transactions. If you want to keep your NFTs safe, it’s a good idea to store them in an Ethereum wallet.

Purchase Your Desired CryptoPunk: Once you’ve completed the setup, you can immediately buy the CryptoPunk artwork you’re interested in. All 10,000 CryptoPunk NFTs artworks are stored on the Ethereum blockchain. To get one, you simply need to purchase it from someone who has one in their collection.

Browse OpenSea Listings: OpenSea has many registered CryptoPunks available for sale. The prices for these collections typically range from around 1 Ethereum to several dozen Ethereum, depending on the specific CryptoPunk NFTs you’re interested in.

Most Expensive CryptoPunk NFTs Ever Sold

Shalom Meckenzie, a parliament member and shareholder in a sports firm, made headlines by purchasing the most expensive CryptoPunk NFT ever sold. He spent a whopping 11.8 million USD on this unique digital artwork during a Sotheby’s auction. This sale broke the previous record held by Alien CryptoPunk #7804, which sold for 7.7 million USD in March 2021.

In addition to these impressive sales, Visa, the credit card company, acquired CryptoPunk for a significant sum of 150,000 USD. And that’s not all; CryptoPunk made another notable sale to a Chinese investor, fetching a price of 380,832 USD, making it one of the highest-priced NFTs sold.

Why are CryptoPunk NFTs so expensive?

You might be wondering why CryptoPunks are so popular. One big reason is that they were one of the very first projects on the Ethereum network. In other words, they were the pioneers of NFTs and inspired many other art projects like Bored Ape Yacht Club, Pudgy Penguins, and others.

Another reason why CryptoPunks are worth a lot is because they are unique and charming. For example, the Alien Avatar is the rarest one and has become the most expensive CryptoPunk NFT ever sold. Their uniqueness and rarity make people really interested in owning them.

In the world of NFTs, CryptoPunk owners are often seen as pioneers and forward-thinkers. Whether right or wrong, they are considered individuals who had the foresight to understand where NFTs were headed and got involved early on. Because of this, they are given a sense of trust and elevated status. Some collectors have even built entire identities, projects, communities, and brands around a single CryptoPunk NFT.

Moreover, CryptoPunks have a history intertwined with the early days of the Ethereum blockchain; some argue that owning one is like making a bet on the significance of NFTs and Ethereum itself. Most of the initial supporters of CryptoPunks weren’t just lucky; they were early participants in the crypto world. As Gmoney mentioned, “You had to be around in crypto early on to get involved with CryptoPunks.”

Future of CryptoPunks

CryptoPunks experienced a surge in popularity during the COVID-19 pandemic, thanks to the growing interest in collector’s items and the increasing fascination with cryptocurrencies and blockchain projects. This combination created the perfect situation for prices to rise significantly.

The price of CryptoPunk portraits is mainly determined by how many people want them. Since there’s a limited supply of CryptoPunks, the key question for NFT investors is whether they believe more and more people will want them or if the demand has already reached its highest point.

There’s a possibility that CryptoPunks could move from being something for a niche group of collectors to becoming mainstream art. Some have even been put up for auction at prestigious places like Christie’s and Sotheby’s, which might attract new bidders to these popular NFTs. However, it’s more likely that those interested in this tech and art project already know about it.

FAQs

Why CryptoPunks so expensive?

CryptoPunks are expensive because they are one of the first NFT projects, and their rarity, unique traits, and historical significance have driven up demand among collectors and investors.

Why are CryptoPunks so famous?

CryptoPunks are famous for being pioneers in the NFT space and for inspiring many other NFT projects. Their unique pixelated art and limited supply also contribute to their fame.

Are CryptoPunks worth anything?

Yes, CryptoPunks are worth a lot. Some have sold for millions of dollars, making them valuable digital assets.

What is the project behind CryptoPunks?

CryptoPunks is a project created by Larva Labs, involving 10,000 unique 24×24 pixel art characters stored on the Ethereum blockchain.

What are the benefits of buying CryptoPunk?

Benefits include potential investment gains, ownership of a piece of NFT history, and participation in the growing NFT ecosystem.

Dash 2 Trade Price Predictions for Today, September 19: D2TUSD Price Remains Pressured above the $0.00616 High Value

Dash 2 Trade Price Forecast: D2TUSD Price Remains Pressured above the $0.00616 High Value (September 19)
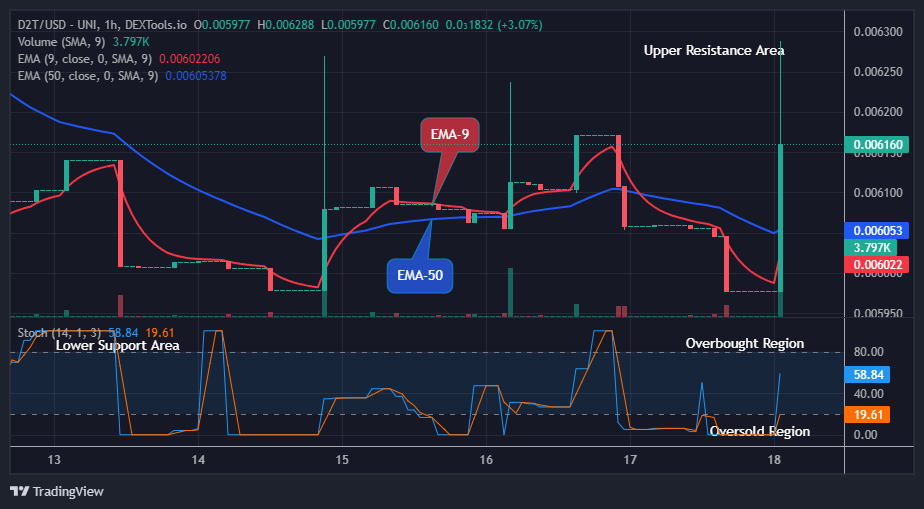
The D2TUSD pair is rising and is on its way to new resistance trend levels. The coin price is at the moment trying hard not to fall by resisting sellers and remains pressured above the $0.00616 high value. In case the bulls’ pressure breaks up the resistance level of $0.00916, the coin price may increase further to a $0.01000 high trend line which indeed will be a turnaround for the coin holders.

Key Levels:
Resistance levels: $0.01000, $0.01100, $0.01200
Support levels: $0.00800, $0.00700, $0.00600

D2T (USD) Long-term Trend: Bullish (4H)
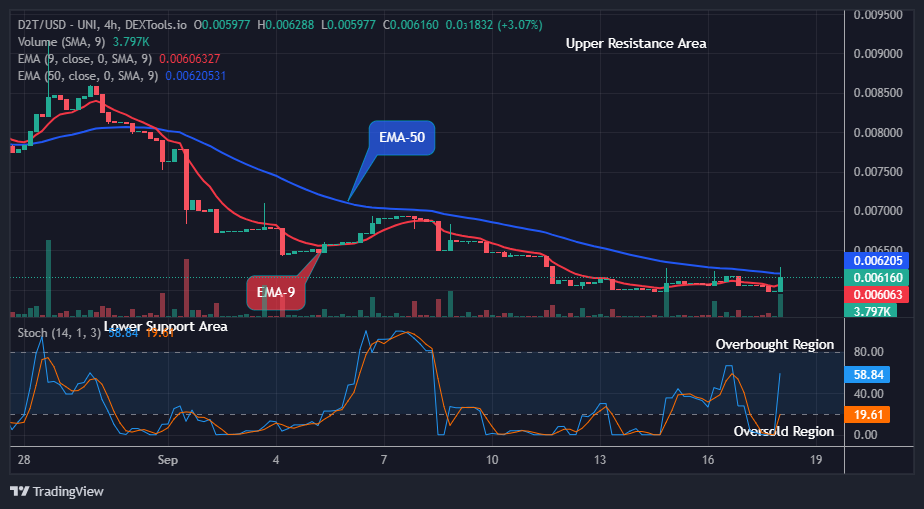
Despite the interference from sellers, the D2TUSD price still trades in the bullish trend market in its higher time frame. Price is trading above the supply trend lines again. This however confirms the presence of more bulls’ impact on the coin.
Dash 2 Trade Price Predictions for Today, September 19: D2TUSD Price Remains Pressured above the $0.00616 High Value
The sustained bullish pressure pushed the price of Dash 2 Trade up to a $0.00605 high level during yesterday’s session and sustained it till its recent high.

The bulls caused a rise to the $0.00628 high level above the moving averages as the 4-hour chart opens today. This indicates that the traders are actively buying at this level. Hence, should the bulls increase their buying motives, the previous high of $0.00916 value might be retested soon.

Notably, the D2TUSD pair however shows the continuation of bullish sentiment on the daily stochastic as the sellers look exhausted while the price of D2TUSD remains pressure above the $0.00616 high value.

Hence, the downside risk remained uncertain; therefore, the next bulls’ target might be a $0.01000 high level in the days ahead in its long-term outlook.

D2T (USD) Medium-term Trend: Bullish (1H Chart)
The Dash 2 Trade price also trades in a bullish trend market in the medium-term outlook. This is due to the high impact of long-term traders on the price flow.
Dash 2 Trade Price Predictions for Today, September 19: D2TUSD Price Remains Pressured above the $0.00616 High Value
The bulls’ pressure on the coin to the $0.00606 supply value during the past session has sustained the coin price above the resistance trend levels in its recent price level.

The bulls made an increase to the $0.00628 supply value above the two EMAs shortly after the 1-hour chart opened today. This indicates that the buy investors are actually dealing in the coin investment.

Therefore, if the bulls could increase their tension in the market, the price tendency will move above the key levels.

Additionally, the D2TUSD price is also pointing upwards, this suggests that the coin price may likely continue in an upward direction and head toward the $0.01000 supply trend line in the days ahead in its medium-term time frame.

With stablecoin holdings at 15%, Smart Money is still on the cautious side, probably in preparation for “red September.” When they think we’ve reached the bottom, they’ll be ready to buy.


Want a coin that has a huge potential for massive returns? That coin is Dash 2 Trade. Buy D2T now.

Sponge/USD ($SPONGE) Climbs New Higher Price Levels

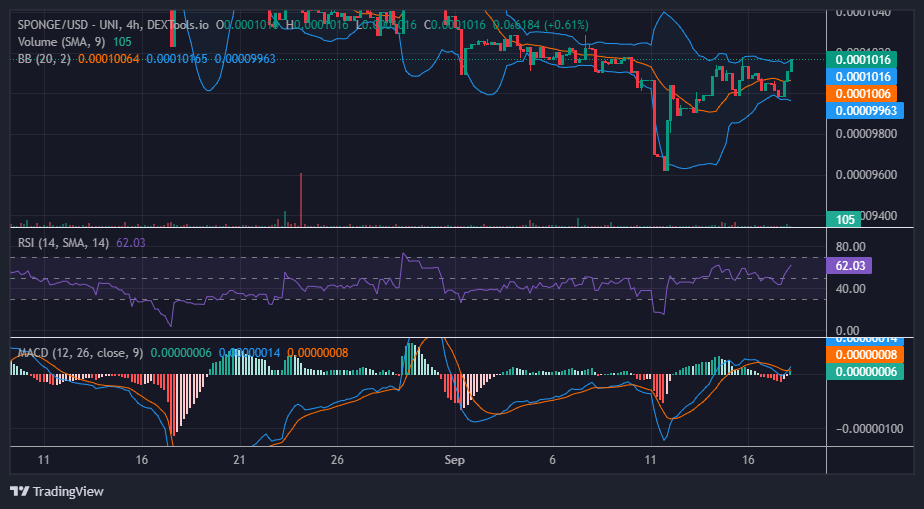
In light of the pronounced and rapid fluctuations occurring within a narrow price channel around the equilibrium level, we anticipate an imminent price breakout. During the transition from yesterday’s trading session to today’s, the SPONGE/USD market found support at the $0.000100 price level. Additionally, a series of three noteworthy bullish candles signals a significant upward movement, approaching a key resistance level in the bull market.

Key Levels

  • Resistance: $0.000115, $0.000120, and $0.000125.
  • Support: $0.00010, $0.000090, and $0.000080.

Sponge/USD ($SPONGE) Climbs New Higher Price Levels

Sponge (SPONGE/USD) Price Analysis: Insights from Indicators

When significant price fluctuations occur within a narrow price channel, it often signals the potential for a breakout from that range. In the case of the SPONGE/USD pair, the breakout appears poised to move upward. This is evident in the consecutive formation of three bullish candles, a highly significant candlestick pattern indicating an imminent bullish breakout.

Additionally, the Relative Strength Index (RSI) is showing robust and significant momentum, currently measuring at 62. Furthermore, the MACD lines are positioned above the zero level in the Moving Average Convergence and Divergence (MACD) indicator. However, it’s worth noting that the upper band of the Bollinger Bands indicator has not yet reacted to this new market development.

Sponge/USD ($SPONGE) Climbs New Higher Price Levels

$SPONGE Short-Term Outlook: 1-Hour Chart

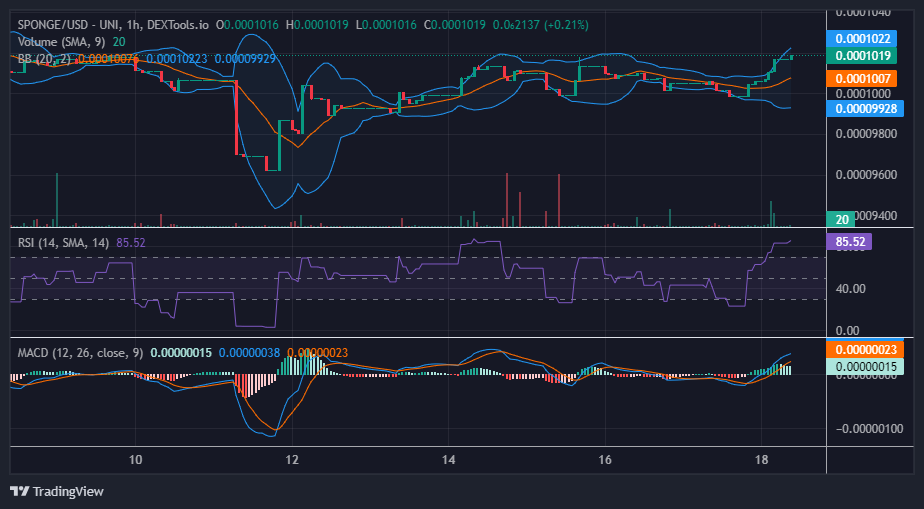
In a shorter timeframe, the Bollinger Bands have exhibited a notable response to the market’s evolution. The bands are diverging, signaling an increase in volatility. Nevertheless, this development has exposed the market to a significant bearish reaction, particularly as it ventures into overbought territory. If, however, the bullish sentiment persists, there is potential for the market to sustain its upward trend and remain within the overbought territory.

The SPONGE/USD token airdrop is still ongoing; take advantage of it.

Invest in the hottest and best meme coin. Buy Sponge ($SPONGE) today!

Chainlink (LINK/USD) Demonstrates a Bullish Breakout

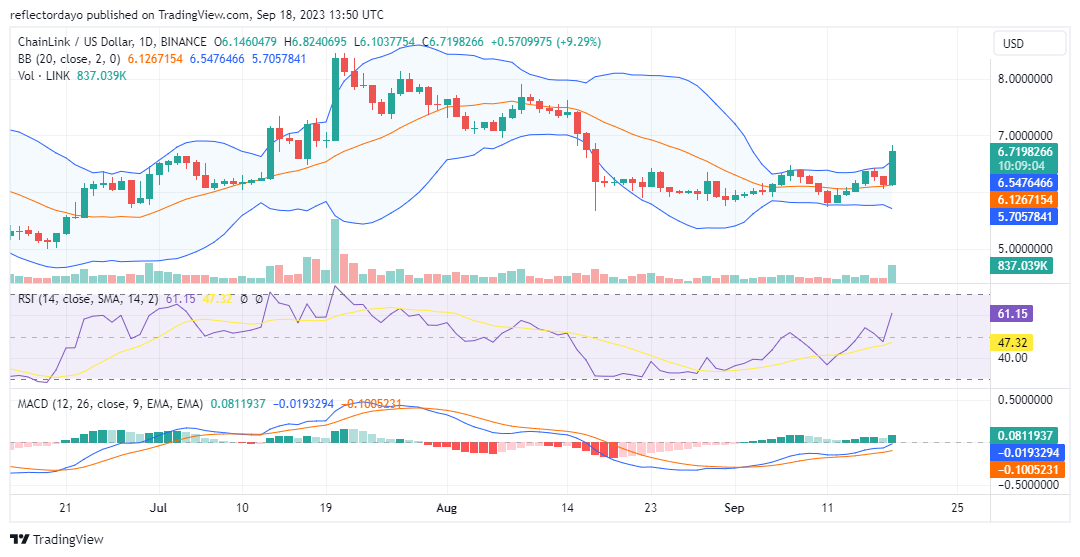
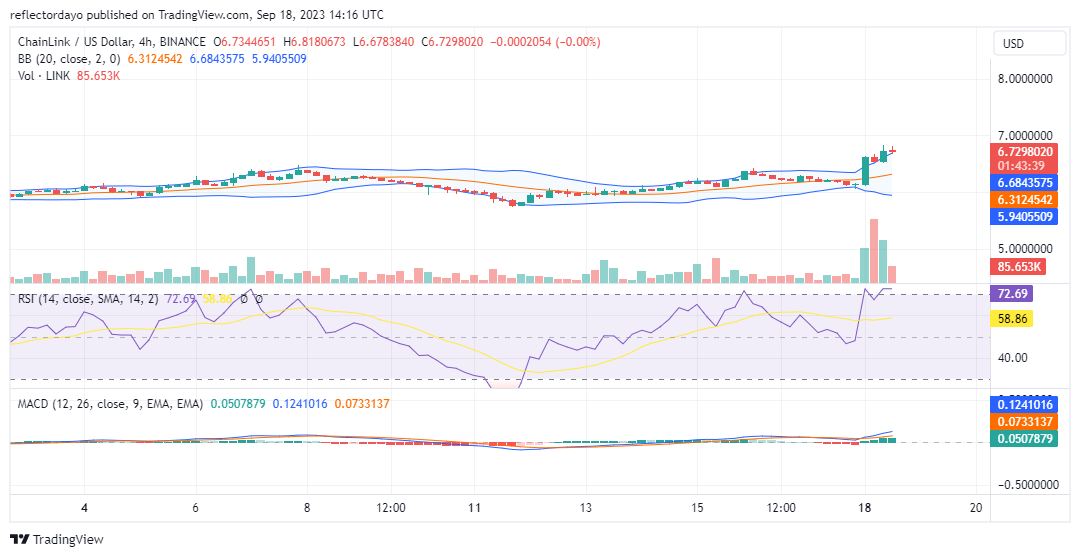
The bear market of August brought the market to the $6.00 price level, and Chainlink has continued to struggle at this level since the second half of August up until today’s market. However, notable changes have transpired since September. As early as the first day of this month, the market has exhibited rapid price oscillations, albeit within a confined price range.

This development could be viewed as a potential signal for both traders and analysts, indicating the market’s readiness for a substantial movement—a scenario that is currently unfolding. As of the present trading session, the market has sustained a noteworthy gain of 11.15%. The bullish sentiment is notably robust.

Chainlink Market Data

  • LINK/USD Price Now: $6.7548
  • LINK/USD Market Cap: $3,761,933,460
  • LINK/USD Circulating Supply: 556,849,970 LINK
  • LINK/USD Total Supply: 1,000,000,000 LINK
  • LINK/USD CoinMarketCap Ranking: #19

Chainlink (LINK/USD) Demonstrates a Bullish Breakout

Key Levels

  • Resistance: $7.00, $7.50, and $8.00.
  • Support: $6.00, $5.50, and $5.00.

Price Prediction for Chainlink: The Indicators’ Point of View

The indicators unequivocally signal a robust bullish market. The Relative Strength Index (RSI) depicts the Chainlink price surging almost vertically, propelling the market from equilibrium into considerably bullish territory. Presently, the momentum registers at 61.27. In the Moving Average Convergence and Divergence (MACD), the MACD line is on the verge of crossing above the zero level.

However, it is essential to consider the readings of the Bollinger Bands and the Volume of Trade indicator. In terms of the Bollinger Bands indicator, although the price executed a notable breakout with a strong bullish candle, the Bands’ divergence lags behind this rapid market development. The upper bands have not responded adequately to the strong bullish market. Additionally, the Volume of Trade indicator boasts an impressive histogram that corroborates the market’s movement, yet its magnitude may not be deemed entirely sufficient to substantiate this market progression. While these indicators may seem somewhat lagging, their subtle signals provide ample support for the prevailing bullish sentiment.

Chainlink (LINK/USD) Demonstrates a Bullish Breakout

LINK/USD 4-Hour Chart Outlook

Examining the market from a 4-hour chart perspective, we observe a deceleration in market momentum. According to the Relative Strength Index (RSI), the market has ventured into overbought territory. This juncture typically invites profit-taking and the potential for a general price correction. Following the identification of a robust higher support level, the market is anticipated to experience a rebound, sustaining its upward trajectory. The $7.00 price point could serve as the next significant milestone for the market.

Buy Chainlink on eToro.

Dogecoin (DOGE/USD) Trade Fluctuates, Holding Below $0.065

Dogecoin Price Prediction – September 18
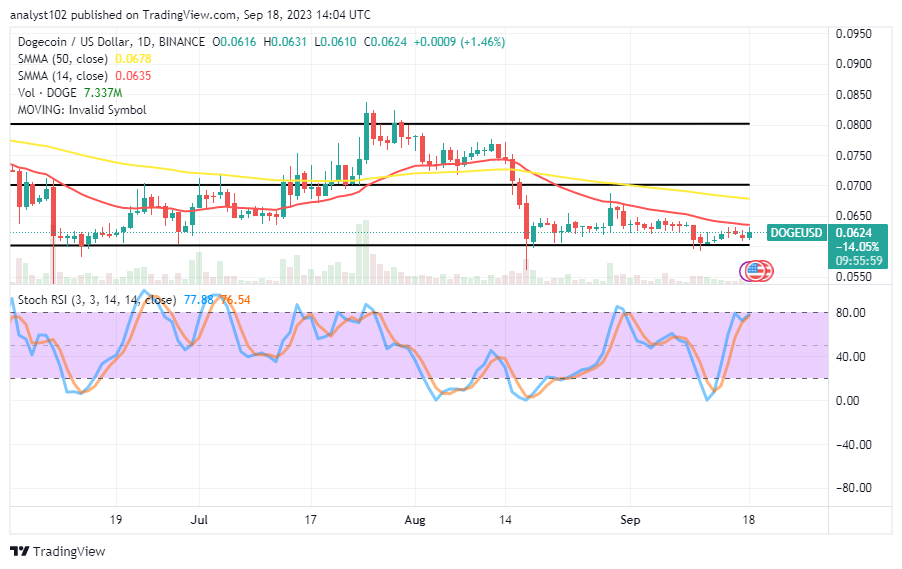
A long-moving in ranges has over time been prevailing around visible points, given that the DOGE/USD trade fluctuates near above the line of $0.060, holding below the value line of $0.065.

The fact that gravitational forces are moving pretty quickly to the north suggests that it may be difficult to advance past some overhead resistances that are located between $0.065 and $0.070. Bulls may nonetheless push in a rallying mode by reaching a higher line in an averaging style to $0.075, if bears lose the positions toward posing a rejection against those value lines.

DOGE/USD Market
Key Levels:
Resistance levels: $0.070, $0.075, $0.080
Support levels: $0.055, $0.050, $0.045

DOGE/USD – Daily Chart
The DOGE/USD daily reveals the crypto-economic trade fluctuates, holding below the point of $0.065 resistance.

The 14-day SMA indicator is underneath the 50-day SMA indicator, marking down the logical resistances that price is tending to encounter if furthering its rising force rate beyond its high point of $0.0631 in the near future. The stochastic oscillators are positioned tightly from 76.54 to 77.88 points.
Dogecoin (DOGE/USD) Trade Fluctuates, Holding Below $0.065
Are there any remaining opportunities for the DOGE to appreciate in value relative to the US coin?
The probability of the DOGE/USD market bulls moving further through overhead resistances away from its current trade spot rated at 1.46% appears to weigh a low gravitational force as the crypto-economic trade fluctuates, holding below the $0.065.
To successfully intercept the larger counterpart to the north, a strong rising pressure would need to appear in its mode of motion above the trend line of the smaller moving average. It will be acknowledged that a confirmation has been staged in this way.

The current transaction line still shows that a lack of decision-making in trading may continue to coexist with potential price increases that the market may be considering breaking through. Bears should be ready to seize an active price action reversal that may manifest soon.
Dogecoin (DOGE/USD) Trade Fluctuates, Holding Below $0.065
DOGE/BTC Price Analysis
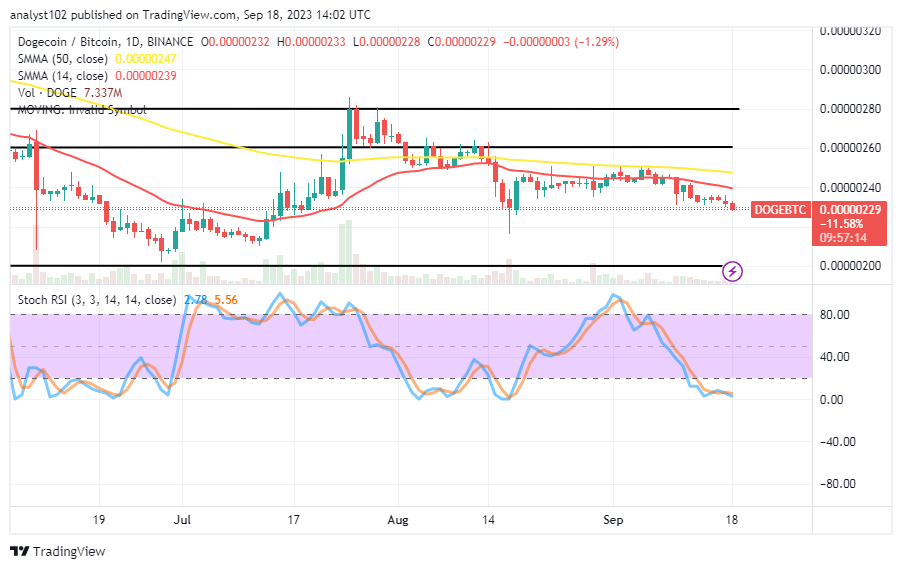
In contrast, the Dogecoin market fluctuates in a slow-and-steady moving motion to the downside against Bitcoin, holding below the trend lines of the moving averages.

The 14-day SMA indicator has been slowly stretching southward underneath the 50-day SMA indicator. The Stochastic Oscillators have traversed into the oversold region. The base cryptocurrency indicates that it is pushing against the counter-trading cryptocurrency in search of support because there has been a bearish trading candlestick. Therefore, sellers should be cautious of any rebound or reversal in the direction of the downward movements..

Note: Cryptosignals.org is not a financial advisor. Do your research before investing your funds in any financial asset or presented product or event. We are not responsible for your investing results.

You can purchase Lucky Block here. Buy LBLOCK