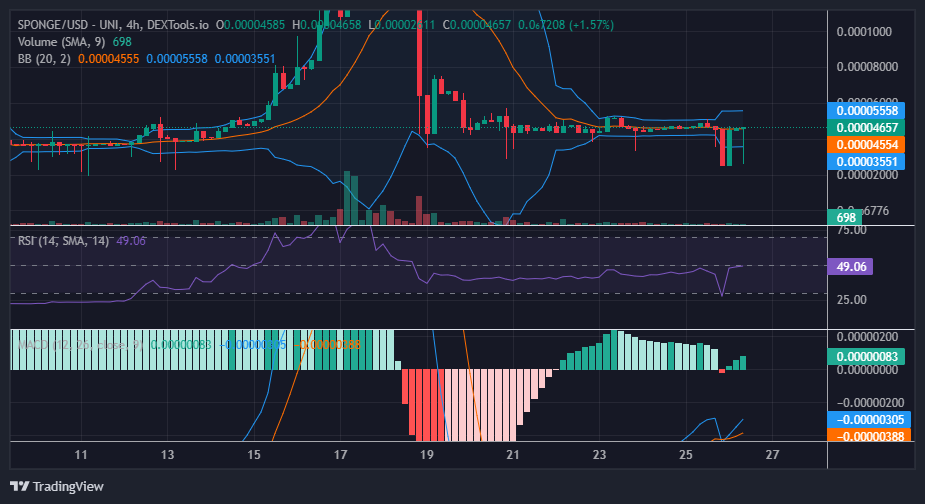
Amidst the swirling currents of the crypto market, $SPONGE has navigated a prolonged stretch of lateral movement, steadfastly tethered to the $0.000045 mark. Despite numerous attempts to pull it under, the market has displayed remarkable buoyancy, steadfastly resisting descent. This intriguing behavior hints at a phase of accumulation, where savvy investors may be quietly amassing assets at current levels, hinting at an underlying resilience or burgeoning interest in the token. Such conduct implies a reluctance among investors to part with their holdings at lower valuations, perhaps signaling a bullish undercurrent or the strategic accumulation by discerning traders.
Key Market Dynamics:
Resistance Levels: $0.0010, $0.0011, and $0.0012.
Support Levels: $0.000035, $0.000030, and $0.000025.
In-Depth Technical Examination for $SPONGE (SPONGE/USD)
Both the Bollinger Bands and the Relative Strength Index have signaled a consolidation around the crucial $0.000045 juncture since February 21st. Meanwhile, the Moving Average Convergence and Divergence (MACD), alongside its histograms, have witnessed a gradual wane in bearish momentum since February 19th, with the two MACD lines flirting with a crossover above the zero line. Thus, the MACD’s crypto signal hints at an underlying bullish drive, notwithstanding the current price channel’s appearance of stagnancy. Consequently, $SPONGE stands on the brink of a notable bullish surge.
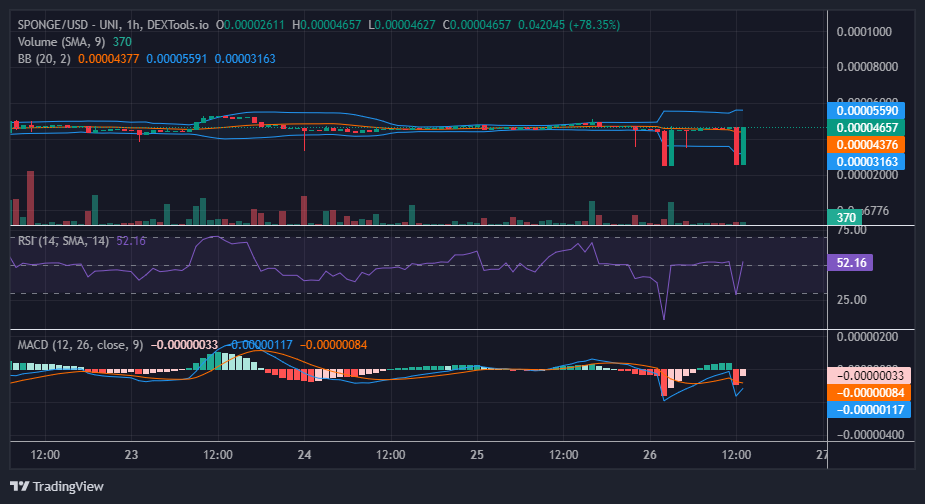
Insights from the Hourly Vantage Point:
On the hourly chart, the market exhibits resilience, firmly anchored around the midpoint denoting equilibrium. Examination of the Relative Strength Index reveals a consistent pattern of price fluctuation around the 50 mark, suggesting the potential for an emergent bullish trajectory. Traders are advised to maintain vigilance and position themselves to seize opportunities presented by potential market updrafts.
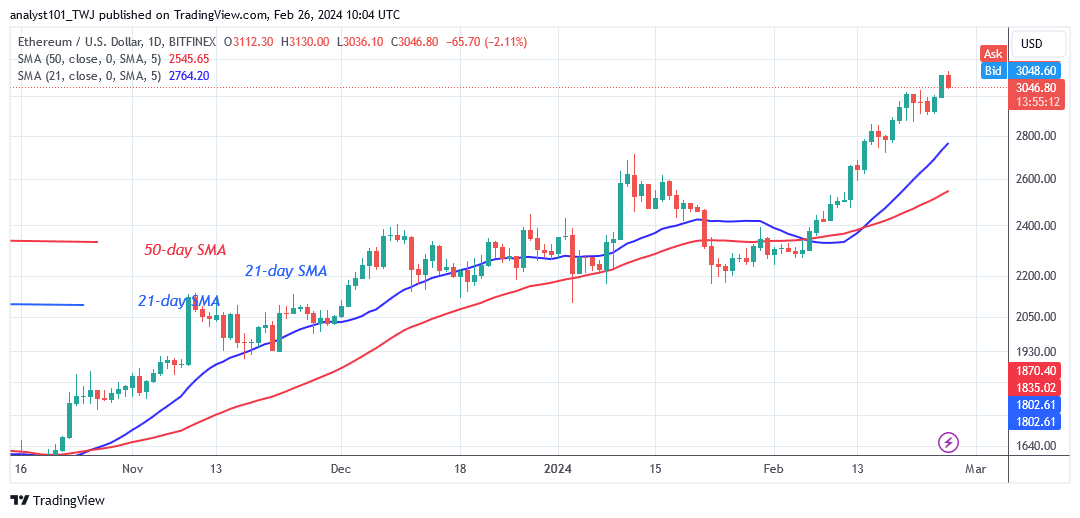
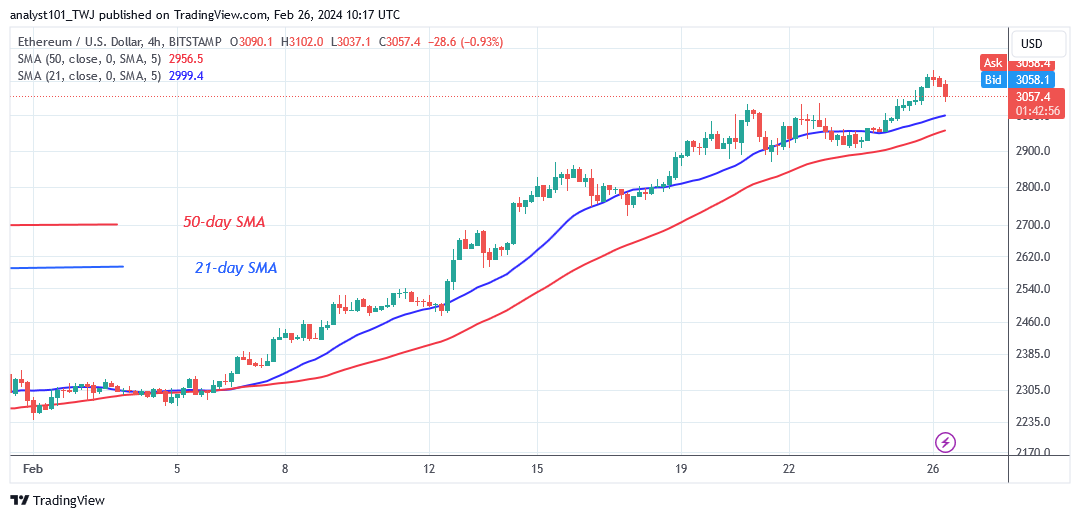
Ethereum Price Long-Term Analysis: Bullish Ethereum’s (ETH) price is retreating after reaching a top of $3,113 as buyers renew upward impetus. Today, Ether has fallen to a low of $3,057.70 as of this writing. There will be a test of the psychological $3,000 price level and selling pressure will increase if the support is broken. The largest altcoin will fall further, reaching the next support level at $2,700.
Conversely, if the altcoin retraces and finds support above the $3,000 price level, it will restart its upward trend. The altcoin will rise and rally to reach a high of $3,300. Meanwhile, ETH/USD is trading just above the $3,000 support level, indicating a further upward move.
ETH/USD – Daily Chart
Technical indicators: Major Resistance Levels – $2, 600, $2,800, $3,000 Major Support Levels – $1.600, $1, 400, $1,200
Ethereum Indicator Analysis The price bars are above the moving average lines as Ether retraces from a recent high. Despite the recent price rebound, the moving average lines are still trending northward, indicating an uptrend. Doji candlesticks, which have a small body and are indecisive, also characterize the price action.
Conclusion Ethereum is in a modest pullback, trading between $3,100 and $3,000 as buyers renew upward impetus. Buyers are currently defending the $3,000 support level in an attempt to rekindle upward momentum. Ether faces additional loss if it loses the $3,000 support. In the meanwhile, the crypto signal remains optimistic, with Ether hovering above the present support.
Note:Cryptosignals.org is not a financial advisor. Do your research before investing your funds in any financial asset or presented product or event. We are not responsible for your investing results
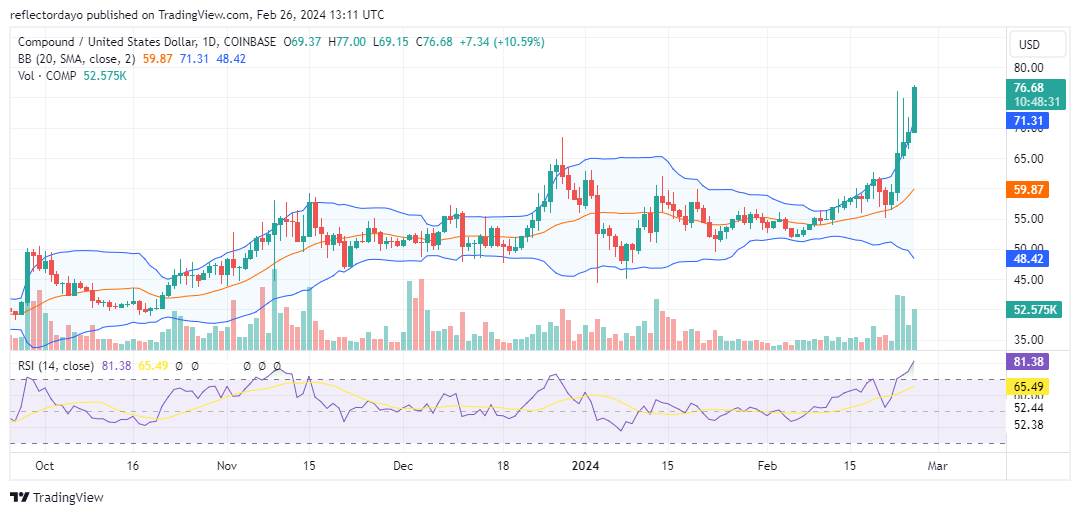
A significant breakout to the upside followed the convergence of the support and resistance levels that began at the start of the year. The Compound market commenced its upward movement on February 10th, gaining further momentum on February 22nd after establishing a strong support level at $56.92. Given the current surge in bullish market activity, traders should anticipate a potential trend reversal in the near future.
The Compound Market Data
COMP/USD Price Now: $76.61
COMP/USD Market Cap: $619 million
COMP/USD Circulating Supply: 8.1 million
COMP/USD Total Supply: 1.1 billion
COMP/USD CoinMarketCap Ranking: #115
Key Levels
Resistance: $80.00, $85.00, and $90.00.
Support: $65.00, $60.00, and $55.00.
The Compound Market Analysis: The Indicators’ Point of View
The current bullish market is underpinned by robust trading volume histograms, indicating prevalent bullish sentiment. While the potential for a trend reversal exists due to the RSI line already residing comfortably in the overbought territory and the significant divergence in the Bollinger Bands indicator, bulls may find support at the $70 mark to sustain the upward trend. However, Compound investors should exercise patience and await confirmation, ensuring that price action remains steady at the $70 level and that the lower band of the Bollinger Bands also follows an upward trajectory before initiating a long trading position. Failure to maintain the $70 price level could trigger a substantial bearish correction in market dynamics.
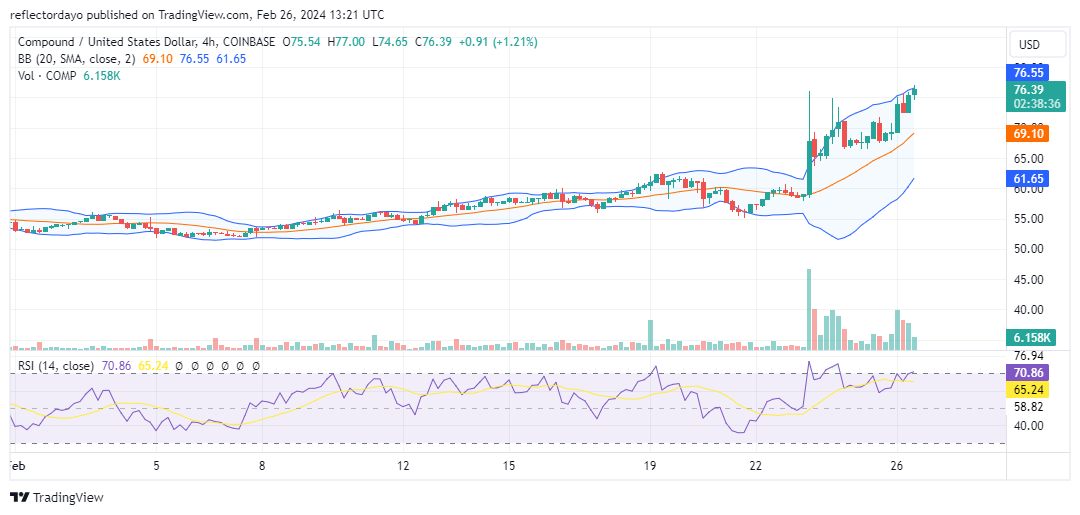
COMP/USD 4-Hour Chart Outlook
Based on the crypto signal from the 4-hour chart analysis of the market, it’s evident that the Bollinger Bands indicator has depicted an upward trending price channel, with a pronounced bandwidth indicating significant volatility. However, as the market surpasses the $75 level, the bullish momentum appears to be waning, signaling a potential correction in the market’s trajectory. When the correction materializes, the $70 mark can be a possible bullish support.
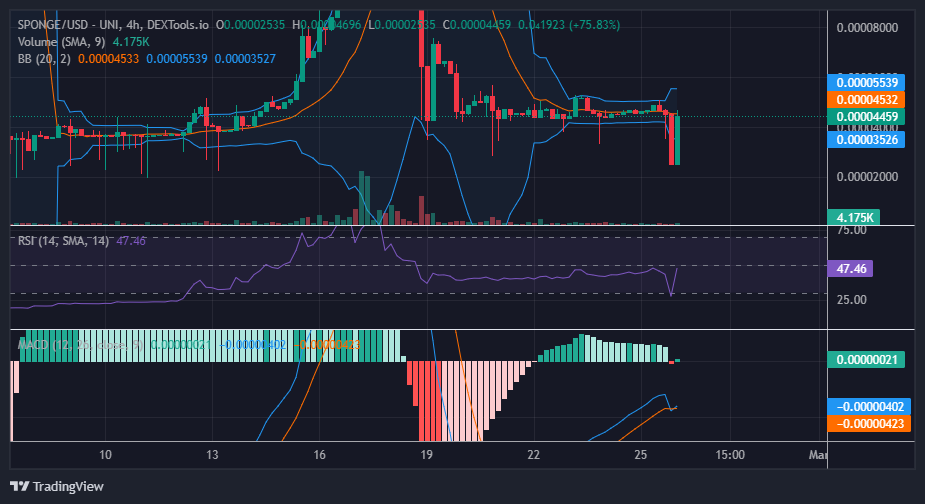
The SPONGE/USD market has experienced a prolonged period of sideways movement, consistently hovering around the $0.000045 price level. Despite numerous tests of lower price levels, the market has shown resilience, failing to break down towards it. This crypto signal hints at a potential accumulation phase underway. In such a scenario, market participants appear to be accumulating assets at the current price level, reflecting underlying strength or interest in the asset. This behavior suggests that investors are hesitant to sell at lower levels, possibly indicating a bullish sentiment or accumulation by astute investors.
Key Market Dynamics:
Resistance Levels: $0.0010, $0.0011, and $0.0012.
Support Levels: $0.000035, $0.000030, and $0.000025.
In-Depth Technical Analysis for $SPONGE (SPONGE/USD)
Both the Bollinger Bands and the Relative Strength Index have been indicating a stabilization in the market around the critical $0.000045 price level since February 21st. However, the Moving Average Convergence and Divergence (MACD), along with its histograms, have shown a gradual decrease in bearish strength since February 19th, with the two MACD lines attempting to cross above the zero level. Consequently, the signal derived from the MACD suggests a potential underlying bullish momentum, despite the current price channel indicating a stagnant market situation. Therefore, SPONGE/USD appears poised for a significant bullish price surge.
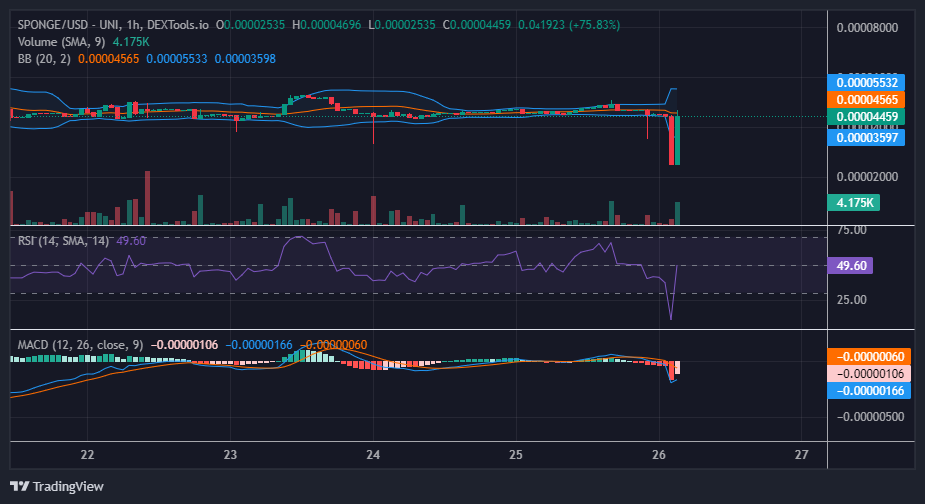
Insights from the 1-Hour Perspective:
From the perspective of the 1-hour chart, the market has remained resilient, firmly holding onto the midpoint, which signifies the equilibrium level. Analysis of the Relative Strength Index reveals a consistent pattern of price oscillation around the 50 level. This sustained price movement suggests the potential for a bullish trend to emerge. Traders are advised to remain vigilant and prepare to capitalize on potential market upswings.
At times, it’s beneficial to remain silent and absorb the damp.
In the early days of the protocol, users received generous airdrops valued at over $15K for depositing just 1 Solana on Jito for a short period.
However, the landscape has shifted significantly since then.
Solana’s Total Value Locked (TVL) has quadrupled, attracting a surge of users, including bots, who are engaging with the network and its ecosystem.
Given these changes, is it still a viable strategy to invest time and capital in farming Solana airdrops?
Below, we’ll explore some current Solana airdrop opportunities.
Parcl
Introducing Parcl: Revolutionizing Real Estate Trading on Solana
Parcl stands out as a groundbreaking Real World Asset (RWA) project operating on the Solana blockchain. With its innovative platform, users can engage in real estate markets with leverage of up to 10x, all executed seamlessly on-chain.
Here are some key insights to consider:
Parcl launched its inaugural points program in December 2023, sparking a meteoric rise in Total Value Locked (TVL) from a mere few million to an impressive $59 million.
Currently, Parcl Points Season 2 is in full swing.
The project’s team successfully secured $11.6 million from venture capitalists, marking the second-largest fundraising achievement for a tokenless DeFi project on Solana. This substantial investment sets the stage for a potentially lucrative valuation of the upcoming Parcl token upon its launch.
Anticipate a significant airdrop opportunity for early adopters, although the extent will hinge on the proportion of the token supply allocated for distribution.
Interested individuals can engage in Parcl’s airdrop farming through two avenues:
Active trading on the platform, where every open position yields 2 points per dollar per day.
providing liquidity by supplying USDC to the Parcl LP pool and rewarding participants with 4 points per dollar provided daily.
To join the airdrop farming initiative, utilize referral code “defi12” on the Parcl referrals page to enjoy a 5% lifetime boost on accumulated points.
Despite raising substantial funding, Parcl boasts a comparatively modest TVL when juxtaposed with other leading Solana decentralized applications (dApps).
Given these factors, I firmly believe that Parcl presents one of the most promising airdrop opportunities within the Solana ecosystem.
Tensor
Navigating through this list, one particular airdrop stands out as the ultimate challenge.
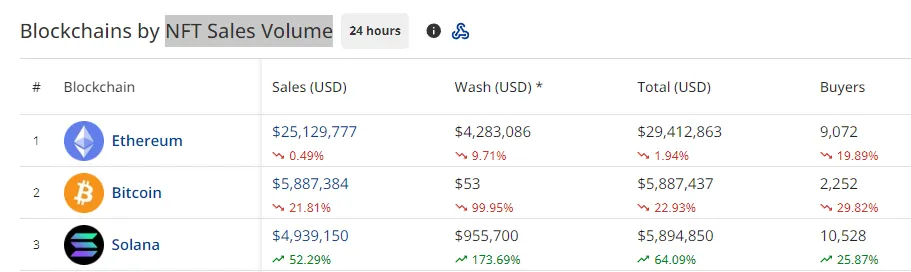
Tensor emerges as the premier NFT marketplace within the Solana ecosystem. Renowned for its robust NFT infrastructure, Solana ranks as the third-largest blockchain by NFT Sales Volume over the past 24 hours.
With such prominence in the NFT space, I anticipate Tensor’s token to command a fully diluted valuation exceeding $1 billion upon its launch.
As Tensor’s Season 3 points program unfolds, it marks a significant milestone, likely serving as the final precursor to the awaited airdrop.
Earning points within Tensor’s ecosystem presents diverse avenues:
Participate in NFT auctions through bidding.
List your NFTs (if you’re a Solana NFT holder).
Engage in market-making activities for NFTs.
Explore Fund Locks by counter-trading individuals involved in short/long positions on Tensor’s NFTs.
For ardent NFT enthusiasts, navigating this terrain may feel like second nature, making the airdrop farming journey relatively straightforward. However, for those less inclined towards NFTs, the process may appear daunting.
In such cases, market-making NFTs emerge as the optimal route for airdrop farming. While this approach demands active management, it presents a viable opportunity, particularly for individuals with limited capital and spare time.
Embrace the challenge, and the rewards may well be worth the effort.
MarginFi
Introducing MarginFi: Solana’s Premier Money Market Hub
MarginFi stands tall as the largest money market platform thriving within the Solana ecosystem. Despite securing a modest $3 million in funding, it has emerged as the cornerstone of DeFi applications on Solana. With an impressive Total Value Locked (TVL) reaching $480 million, MarginFi reigns as the chain’s most dominant dApp in terms of TVL.
Having operated its points program for over 7 months, MarginFi continues to attract users. However, the program’s end date remains undisclosed, adding an element of uncertainty to the equation.
Participating in MarginFi’s points farming initiative is straightforward:
Every dollar lent garners 1 point per day.
Borrowing $1 yields 4 points daily.
While MarginFi presents a lucrative airdrop opportunity, the sheer number of over 100k wallet addresses already engaged in point farming has diluted the potential rewards. Nevertheless, there’s hope that a tiered airdrop system, akin to Jito’s approach, could salvage its success.
Anticipating the launch of MarginFi’s token, its substantial TVL suggests a valuation potentially reaching into the billions.
Although I’m actively farming this airdrop, I’ve begun diversifying my assets in Kamino. The Kamino airdrop appears less saturated, hinting at a promising opportunity.
Conclusion
In my assessment, Solana airdrops still hold significant value for savvy farmers.
While it’s unlikely to replicate the windfall of $15k per wallet witnessed with Jito’s airdrop, there’s still ample opportunity to generate respectable earnings through Solana airdrop farming.
This endeavor is particularly worthwhile for individuals with limited capital, as many Solana projects have adopted multi-tiered distribution models, offering a fair chance for smaller portfolios to participate.
If I were to prioritize airdrops based on potential, my ranking would be as follows:
1. Tensor
2. Parcl
3. MarginFi
Tensor claims the top spot due to its perceived difficulty in farming, suggesting a narrower pool of qualifying users and potentially larger rewards for those eligible.
With fewer eligible participants, the likelihood of a substantial airdrop for qualifying users significantly increases.
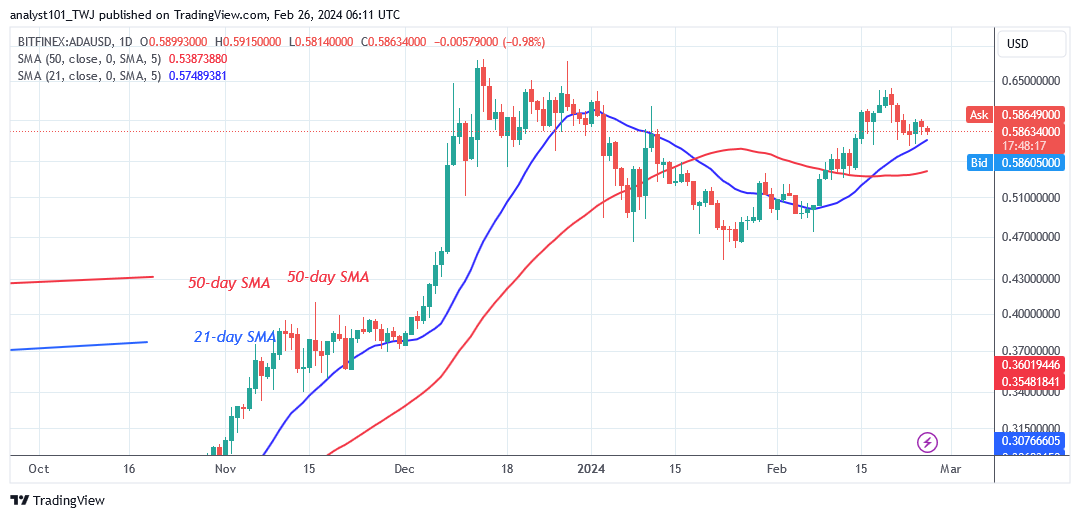
Cardano (ADA) Price Long-Term Forecast: Bullish Cardano’s (ADA) price has retraced above the moving average lines as it aims to resume its ascent. Bears have pushed the cryptocurrency’s price above the 21-day SMA since February 23, 2024. The 21-day SMA will define the altcoin’s market direction. Cardano’s bullish ascension will resume if it remains above the 21-day SMA. Buyers will attempt to break through the resistance levels of $0.64 and $0.68.
Conversely, if the 21-day SMA is broken, the altcoin will fall above the 50-day SMA, which is equal to $0.53. The crypto will fall further, reaching a low of $0.46. Meanwhile, the ADA price is hovering above the 21-day simple moving average.
ADA/USD – Daily Chart
Technical Indicators: Major supply zones: $1.0, $1.05, $1.10 Major demand zones: $0.25, $0.20, $0.15
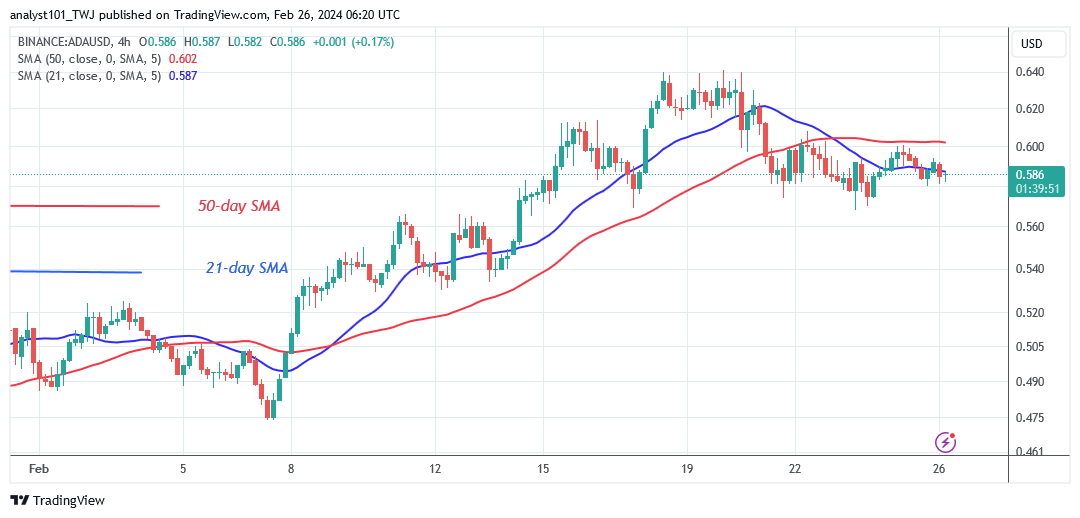
Cardano (ADA) Indicator Analysis The cryptocurrency’s price bars have retraced above their moving average lines. It’s unknown whether the cryptocurrency price will go below the 21-day SMA or not. Cardano will appreciate it if the 21-day SMA support continues. On the 4-hour chart, the price bars are positioned between the moving average lines.
What Is the Next Move for Cardano (ADA)? Cardano has ended its retracement above the moving average lines as it aims to resume its ascent. The cryptocurrency asset is waiting for its next move, as it remains above the moving average lines. The cryptocurrency signal will be positive if the price remains above the moving average lines. On the other hand, the crypto signal would be negative if the 21-day SMA support was broken.
Note:Cryptosignals.org is not a financial advisor. Do your research before investing your funds in any financial asset or presented product or event. We are not responsible for your investing results
The pace of rises and decreases in the exchange lines that involve Dogecoin and the US Dollar has been put between the trade points of $0.09 and $0.08, as the crypto market is less active, searching for a footstep.
Given that the American dollar looks to be exerting little impact on the market, the Bollinger Band trend line in the middle has played a crucial role in defining the baseline settling. Traders will have to wait for more turbulent price actions, either up or down, in order to select when to launch a position in the progression faith of that condition tending to prolong. Nevertheless, capitalists should continue to stick to their investments.
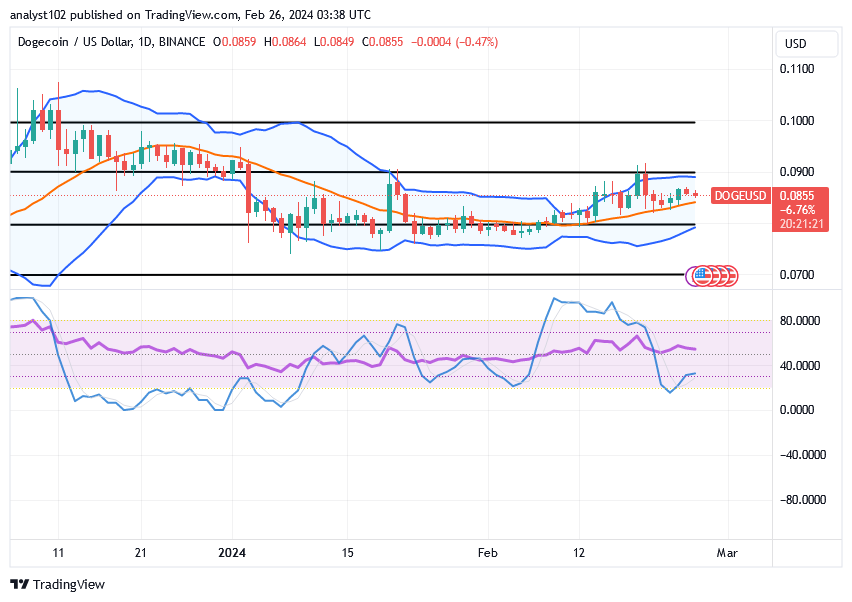
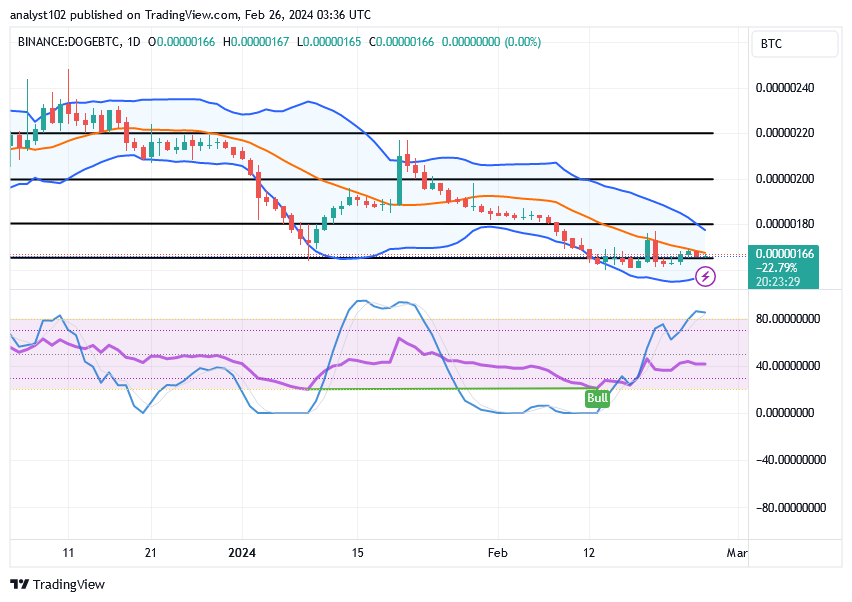
DOGE/USD – Daily Chart The DOGE/USD daily showcases that the crypto-economic market is less active, searching for a footstep within the Bollinger Band indicator.
The featured set-up of variant candlesticks has been produced around the pathway of the middle Bollinger Band that is tentatively placing northward as of the time of this analysis. The stochastic oscillators have traversed southerly to place around 20, nearing the oversold ara, portending that a falling price is getting to a point of exhaustion.
Are there further lows needed for the DOGE/USD market to establish the necessary stance to resume a bullish trend?
It appears necessary for the DOGE/USD market to either go more a bit significant in its correctional mode or to prolong a line of lower lows purposely for uprising forces gathering, as the price currently seen to be less active, searching for a footstep.
Concerning the technicality of the crypto signal in terms of anticipating bulls to seize control of the market, a scenario that creates space for a decline into the region beneath the middle Bollinger Band coupling along with a swift rebounding force would provide a favorable entry longing order.
Given that the price has moved from the location of the upper Bollinger Band trend line to the middle Bollinger Band trend line a few times, it might be a risky opportunity to place a short order at this point. It doesn’t appear like the ensuing dropping forces will hang around at the lower Bollinger Band trend line for very long. DOGE/BTC Price Analysis In contrast, the Dogecoin market shows to be less active versus the stances of Bitcoin, as the former instrument remains searching for a footstep.
The stochastic oscillators’ current position in the overbought area suggests that there may be an opportunity to witness a sequence of events leading to a halt to specific price movements. The positions of the Bollinger Band indicators indicate that further debasement moves are unlikely to emerge without quickly reaching a checkmate.
Note:Cryptosignals.org is not a financial advisor. Do your research before investing your funds in any financial asset or presented product or event. We are not responsible for your investing results.
Dash 2 Trade Price Forecast: D2TUSD Price Is Set to Grow More (February 26) The D2TUSD price is set to grow more which is another opportunity to buy. The coin is back in the green again as bulls push to reclaim the $0.00800 resistance and hold a recovery opportunity with a bullish reversal pattern. The coin price is actually on its way to the critical supply level and may likely continue provided the buy investors add more strength to their actions and push the coin upward. The coin might turn upside down further to the $0.01000 high level and beyond.
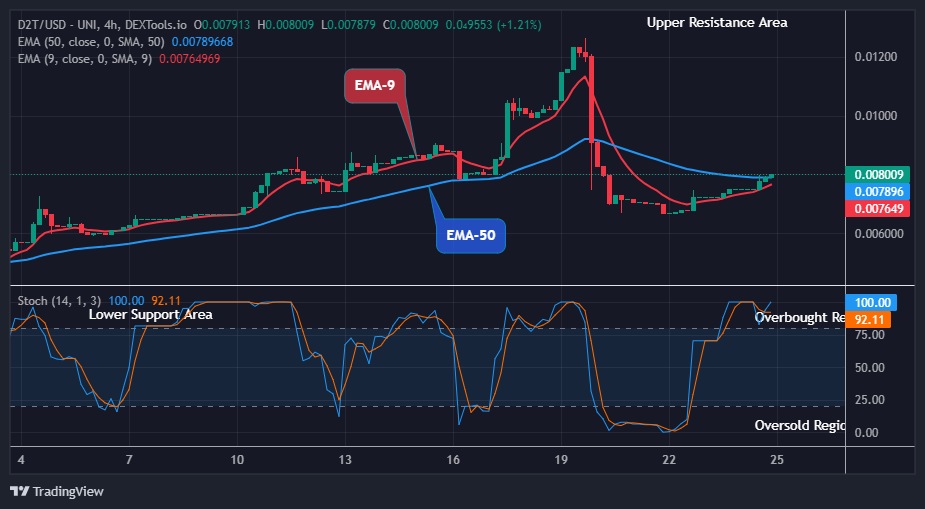
D2T (USD) Long-term Trend: Bullish (4H) D2TUSD remains in a bullish trend in its long-term outlook. The Bulls are trying not to fall this time around. Further, the coin prices are traded above the two EMAs, this confirms a bullish trend. During yesterday’s session, the pair reached and held the $0.00795 resistance level. This has made it possible for the Dash 2 Trade market to remain in an uptrend in its recent high.
The bulls made an increase to the $0.00800 supply value above the supply levels shortly after the 4-hourly chart opened today. This indicates that the buy investors are dealing in the coin investment.
However, the currency pair could grow further if the buy traders managed to break up the $0.01232 previous high level, maintaining a further growth potential for the buy traders.
Notably, the underlying sentiment suggests an uptrend continuation in the coming days as indicated by the daily stochastic. It is therefore expected of buyers to push the price of D2TUSD further up to a significant level and in this case, the target might be the $0.01000 upper resistance level in the days ahead in its long-term view.
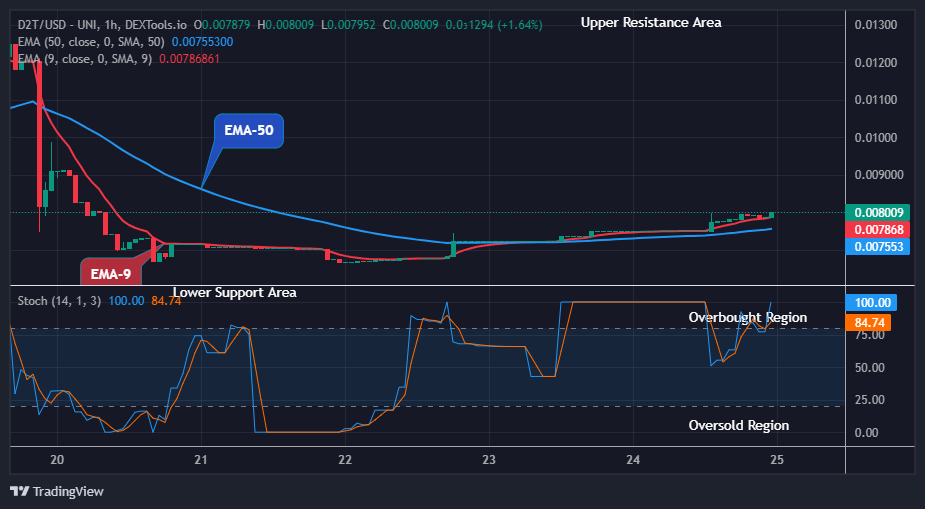
D2T (USD) Medium-term Trend: Bullish (1H) The high inflows from the buy traders also made the D2TUSD price trades in the bullish trend zone in its medium-term outlook. The coin has been making higher highs and higher lows in previous actions; this has made it possible for the price to maintain an uptrend in its recent price level.
The coin price on the 1-hourly chart today is currently trading above the two EMAs at the $0.00800 correction level. This affirms the high bullish impact on the crypto. Further, the rising prices reclaimed more confirmation for a bullish recovery.
Hence, should the buying pressure persist, and the bulls close the hourly chart above the $0.01266 previous high mark, the ongoing recovery could lead the market price of D2TUSD to remain stable at the upside and stop any further bearish moves.
Adding to this, the price pointing upwards on the daily stochastic means that further upside is certain. It is therefore expected that the buy investors will move the Dash 2 Trade price up and may likely hit the $0.01000 supply level soon in its medium-term time frame.
Exciting News! We’ve published an extensive post on how to sign up for Dash 2 Trade!
Exciting news!🚀
We've released a comprehensive article on the process of subscribing to Dash 2 Trade! 📊
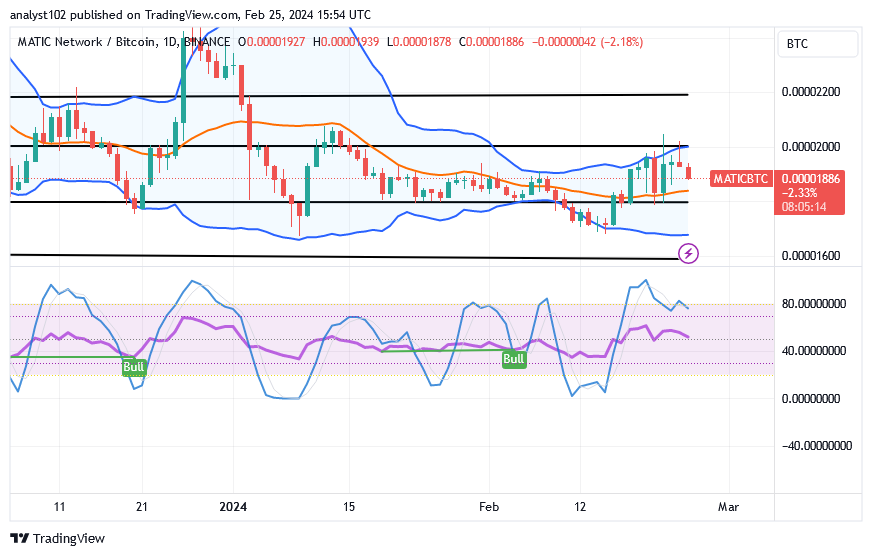
The crypto signal momentum that is featured in the Polygon trade versus the worth of the US Dollar appears to rise back quickly against the resistance spot of $1.10, as the situation has been to be reversing some points that have been obtained close to it from the underneath, trying to grain a base.
As of the time of this analysis, the rate of dropping forces has been gradually acquiring a decrease that is appealing to attaining a shorting entry. In the meantime, most activities relating to the execution of any position orders may be suspended for a while because it seems that they are relatively in recessive motion, causing a kind of indecision.
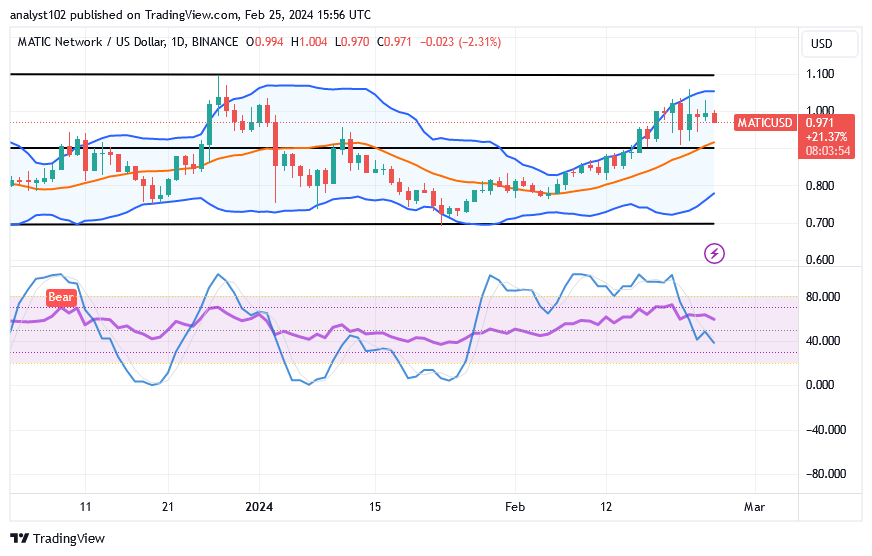
MATIC/USD – Daily Chart The MATIC/USD daily chart showcases that the crypto-economic market has been reversing points, trying to regain a base.
The process that tends to lead to a development that will lead to the market’s capacity of regaining the base will be when a notable candlestick merges purposely to rise above some of the lengths of the penultimate decreasing candlesticks. As of the time of this technical write-up, the stochastic oscillators have been placed southbound to reach the point of 40.
Should investors start to progressively withdraw from the MATIC/USD market given the forecast of the indicators’ conditions?
It might be a good technical trade approach for capitalists to pull out some of their positions in profits before a rebound surfaces, as the MATIC/USD market is reversing, trying to regain a base.
Around $0.90, the middle Bollinger line is observed to be providing support. If there are significant declines ahead, the lower Bollinger Band is about to indicate that a lower point at $0.80 will ultimately be the more difficult support to overcome.
When discussing the southward price movements, it is crucial to take into account the resistance level of $1.05, where the price experienced rejections before gradually turning downward. Having said that, sellers need to be cautious in case the price moves back up if the following active move doesn’t bring it down to a minimum of $0.090 or $0.80. MATIC/BTC Price Analysis In comparison, the Polygon trade has embarked on a reversing move against Bitcoin, not tending to regain a base in the near future.
The stochastic oscillators’ posture in the overbought area indicates that certain lines will decrease against the core cryptocurrency economy for a time. The Bollinger Band indicators are placed tentatively to maintain the wide range-bound spots that the pairing crypto market has been pushing over a couple of times. That demonstrates that a series of delays have occurred, allowing the price to retake lower zone positions.
Note:Cryptosignals.org is not a financial advisor. Do your research before investing your funds in any financial asset or presented product or event. We are not responsible for your investing results.