Shiba Inu (SHIBUSD) Anticipates a Bullish Resurgence

Price Analysis: SHIBUSD Highlights a Resurgence of Bullish Momentum

In early August 2024, SHIBUSD experienced a period of consolidation below the $0.00001530 price level. This accumulation phase set the stage for the first significant bullish breakout in late September. The breakout signaled growing market interest and marked the beginning of a broader upward trend.

Shiba Inu Key Levels

Demand Levels: $0.00002160, $0.00001530
Supply Levels: $0.00002890, $0.00003410

Shiba Inu (SHIBUSD) Anticipates a Bullish Resurgence
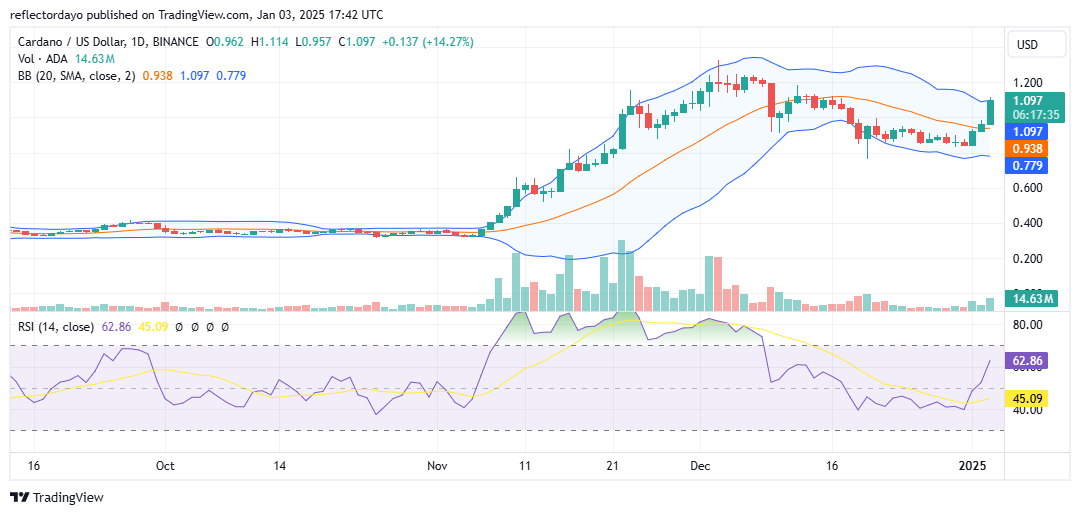
After the September rally, SHIBUSD entered another consolidation phase, forming a base near the $0.00002890 resistance level. This resistance was breached slightly before an immediate reversal occurred. However, in mid-November, the price decisively broke through this level, confirming a bullish structure and reigniting upward momentum.

As the price approached the $0.00003410 level, a bearish trend emerged, leading to a decline and a lower low. This pullback found support at a daily order block, establishing a failed low and signaling the resumption of the bullish trend.

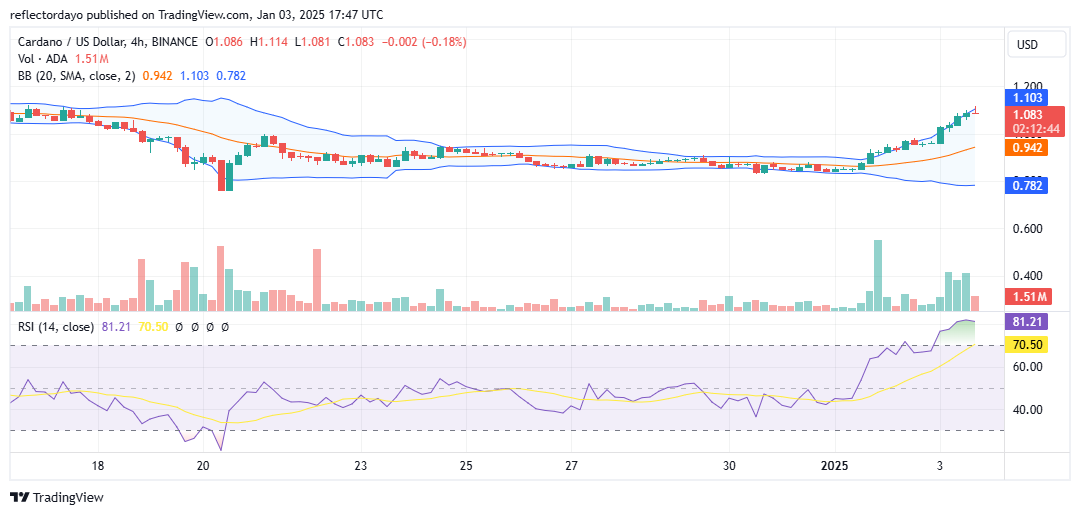
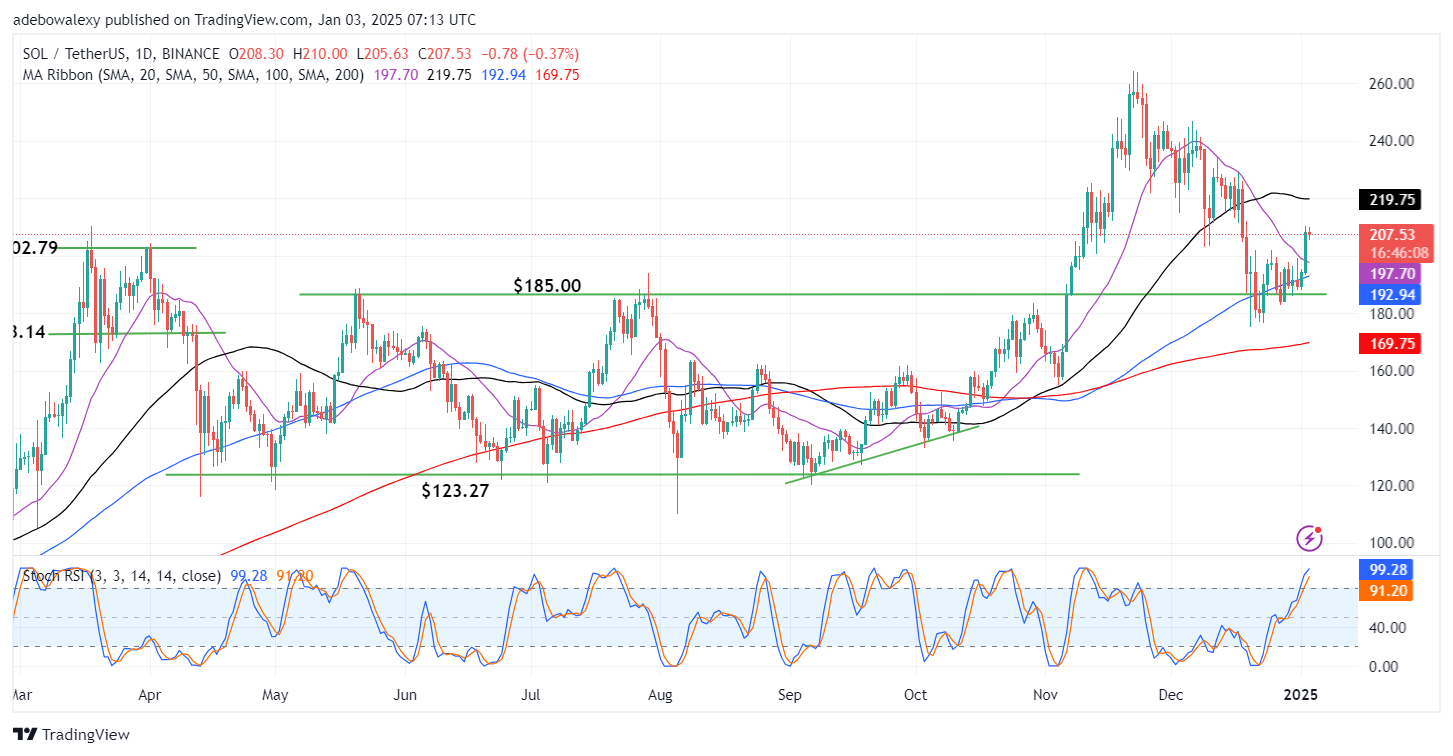
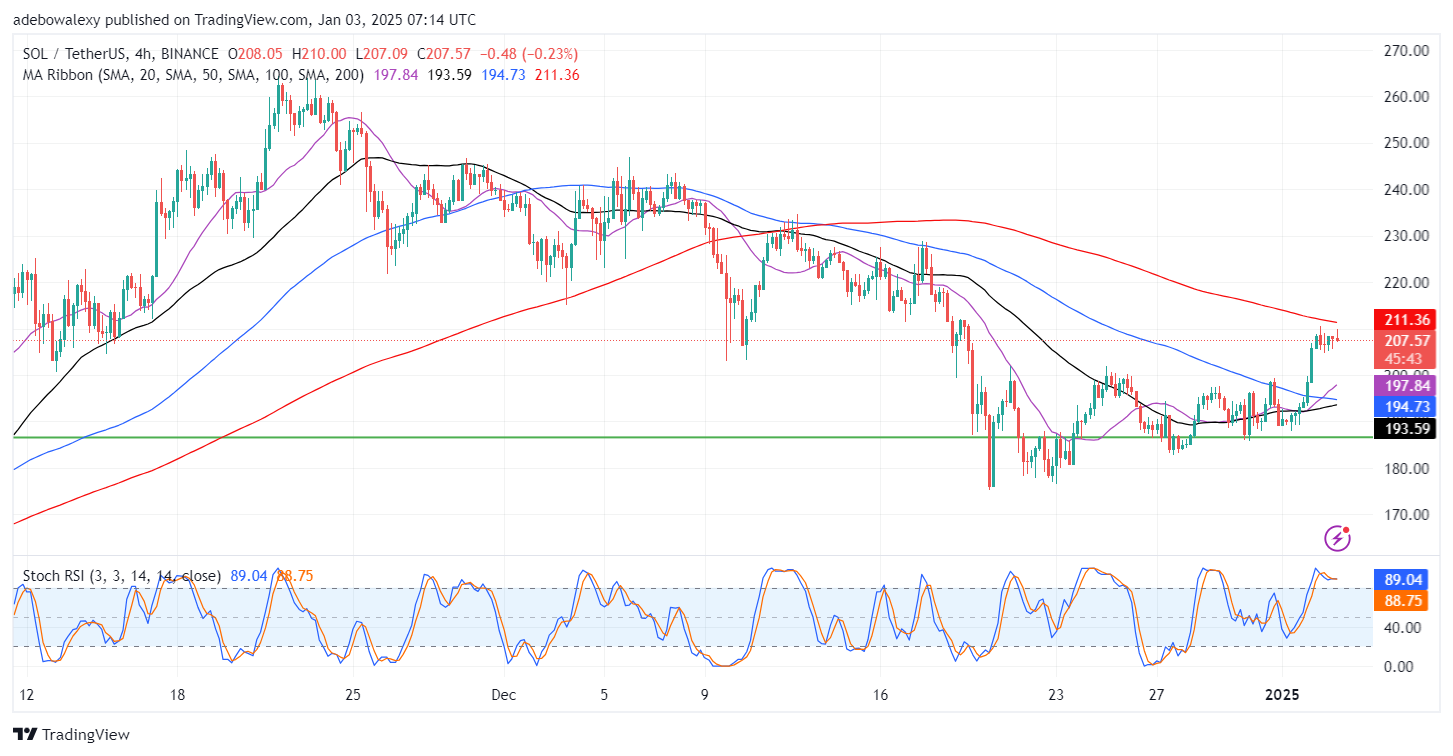
The 4-hour timeframe depicted a trend reversal as the bearish trendline resistance was broken. Technical indicators on the daily chart further validated the bullish outlook. The price traded above the daily Moving Average, suggesting the onset of a new upward trend. Additionally, the Relative Strength Index (RSI) showed rising price strength, aligning with bullish expectations.

Shiba Inu (SHIBUSD) Anticipates a Bullish Resurgence

Market Expectation

Given the ongoing bullish momentum, SHIBUSD is expected to revisit and break the $0.00002890 resistance level convincingly. Furthermore, a successful breach of the $0.00003410 level could pave the way for higher price targets as market sentiment strengthens.

You can purchase Lucky Block here.  Buy LBLOCK

Note: Cryptosignals.org is not a financial advisor. Do your research before investing your funds in any financial asset or presented product or event. We are not responsible for your investing results

Enjin Coin Buyers Build Momentum for a Potential Breakout

ENJUSD Analysis – Enjin Coin Buyers Are Gradually Picking Up Pace

Enjin Coin buyers build momentum for a potential breakout. After a prolonged period of consolidation, the bulls are beginning to show signs of renewed activity, though a stronger push is needed to trigger expansion.

ENJUSD Key Levels

Resistance Levels: $0.2500, $0.3000
Support Levels: $0.2000, $0.1800

Enjin Coin Buyers Build Momentum for a Potential Breakout

Enjin’s price has been tied down in consolidation since bears took control in December, following a rejection at the $0.4000 resistance level. Sellers pushed the price to $0.2000, but the level held firm, preventing further declines.

Now, buyers are accumulating strength, with the Stochastic Oscillator rising upward, indicating renewed bullish sentiment. The Momentum indicator also shows an increasing willingness among buyers to gain control. However, for a significant bullish move, buyers need to break decisively above resistance at $0.2500.

If buyers sustain their momentum and break above $0.2500, Enjin could target the $0.3000 resistance level in the near term. A breakout at this level would confirm a stronger bullish trend, setting the stage for further gains.

Enjin Coin Buyers Build Momentum for a Potential Breakout

Market Expectation

On the shorter time frame, Enjin Coin buyers are gradually building strength, but the market remains in an accumulation phase. The Stochastic Oscillator continues to forge ahead, signaling potential bullish movement, while the Momentum indicator reflects increasing buyer activity.

If the buyers can maintain their current momentum, Enjin could rise toward $0.2300 in the medium term. A failure to sustain this momentum, however, may lead to further consolidation before another breakout attempt.

You can purchase Lucky Block here.  Buy LBLOCK

Note: Cryptosignals.org is not a financial advisor. Do your research before investing your funds in any financial asset or presented product or event. We are not responsible for your investing results

Chiliz (CHZUSD) Buyers Aim for Breakout

CHZUSD Analysis – Chiliz Buyers Aim for a Bullish Ride

Chiliz buyers aim for breakout. The crypto market is showing early signs of bullish momentum as buyers gain control, trading at $0.08700 and poised to push higher. The market has been consolidating above the $0.08040 significant zone, but buyers are now preparing to break free from this phase.

Chiliz Key Levels

Resistance Levels: $0.09300, $0.10000
Support Levels: $0.08040, $0.07500

Chiliz (CHZUSD) Buyers Aim for Breakout

Chiliz has been consolidating after sellers pushed the price down from the $0.13300 key level in December. The $0.08040 support zone has proven resilient, and with the new month underway, buyers are gradually gaining traction to challenge higher levels.

The Momentum indicator is springing up, reflecting renewed buying interest, while the Stochastic Oscillator is also rising, signaling increased bullish sentiment. These indicators suggest that buyers are building strength and preparing for a breakout above the $0.09300 resistance level.

If buyers successfully break out of the consolidation phase, Chiliz could target the $0.09300 resistance level, with a further move toward $0.10000 if bullish momentum persists. This would solidify the upward trend and open the door for more gains in the medium term.

Chiliz (CHZUSD) Buyers Aim for Breakout

Market Expectation

On the shorter time frame, buyers are lifting strength, attempting to break through the consolidation zone. The Momentum indicator is rising steadily, suggesting increased volatility that could fuel bullish action.

If the buyers maintain this momentum, Chiliz could climb toward $0.09000 in the short term. A failure to break out could result in continued consolidation near $0.08500 before another bullish attempt.

You can purchase Lucky Block here.  Buy LBLOCK

Note: Cryptosignals.org is not a financial advisor. Do your research before investing your funds in any financial asset or presented product or event. We are not responsible for your investing results

Cardano (ADA/USD) Bulls Rally, Momentum Slows as Price Approaches $1.110

The $1.110 price level is a critical point of contention between buyers and sellers, particularly as the bearish trend progresses. This level serves as a significant area of resistance. With the ongoing bullish momentum, the price has reached this level, encountering strong resistance that has led to a minor correction or pullback.

Given the evident struggle between buyers and sellers at this level, a period of market consolidation is likely. However, if the market breaks out decisively above this level, it could trigger increased momentum, potentially driving the price toward the $1.20 mark.

Cardano Market Data

  • ADA/USD Price Now: $1.092
  • ADA/USD Market Cap: $38 billion
  • ADA/USD Circulating Supply: 35 billion ADA
  • ADA/USD Total Supply: 45 billion ADA
  • ADA/USD CoinMarketCap Ranking: #9

Cardano (ADA/USD) Bulls Rally, Momentum Slows as Price Approaches $1.110

Key Levels

  • Resistance: $1.11, $1.20, and $1.30
  • Support: $0.90, $0.80, and $0.75.

Cardano Through the Lens of Indicators

The Cardano market remained below the $0.40 price level for an extended period, dating back to August of last year. This trend persisted until early November, when the price experienced a significant surge, reaching approximately $1.20. However, profit-taking at this level quickly reversed the bullish momentum, leading to a substantial decline as sellers overwhelmed the market.

During the bearish phase, the market broke through two major price levels—$1.11 and $1.10—on its downward trajectory. At the start of the new year, the market experienced a rebound, with $0.85 serving as a critical support level. This recovery in the crypto signal pushed the price upward, breaking through the $1.00 resistance. However, the next key level to overcome is $1.10, which traders are likely monitoring closely as a pivotal resistance point.

The Relative Strength Index (RSI) currently stands at 62, indicating moderate bullish momentum. This suggests that the bulls may still have room to push the price higher. However, the rising RSI also signals that the market could soon approach overbought territory, potentially slowing the recovery.

Cardano (ADA/USD) Bulls Rally, Momentum Slows as Price Approaches $1.110

ADA/USD Price Prediction: 4-Hour Chart Analysis

The strength of the bullish run is clearly evident on the 4-hour chart, where the initial momentum appears strong. However, as the market approaches the $1.100 price level, the bullish momentum begins to decline significantly. The Relative Strength Index (RSI) indicates that, from the perspective of the 4-hour chart, the market is currently overbought. Consequently, the most recent candlestick patterns suggest that the market may be preparing for a downward correction. If this correction occurs, the $1.00 price level could serve as the next potential support point for a market rebound.

Trade crypto coins on BYBIT!

$SPONGE (SPONGE/USD) Market Analysis: Bulls and Bears in a Dynamic Standoff

The $SPONGE market is currently in a state of heightened tension, with bulls and bears fiercely contesting control. The $0.000026 level has emerged as a key battleground, reflecting the struggle between these opposing forces. Recently, bearish momentum has successfully established a lower support near $0.0000006, consolidating their foothold. Additionally, the bears have mounted a strong defense around the $0.00004 resistance level, extending their influence closer to the $0.00003 zone.

Despite this, bullish forces have begun to reassert themselves. A surge in buying activity near the $0.0000006 support has triggered a rebound, driving the price back toward $0.00003. This recovery is gradually eroding bearish control and testing the first significant resistance level. If the bulls manage to achieve a decisive breakout above $0.00003, it could pave the way for further gains, potentially pushing the price toward the $0.00005 target.

Key Market Dynamics:

  • Resistance Levels: $0.00005, $0.000055, $0.000060
  • Support Levels: $0.000020, $0.0000195, $0.000019

$SPONGE (SPONGE/USD) Market Analysis: Bulls and Bears in a Dynamic Standoff

$SPONGE (SPONGE/USD) Technical Outlook

The $SPONGE market has entered a consolidation phase around the $0.000026 support level. While this phase appears relatively stable, occasional price spikes hint at potential volatility, possibly signaling an imminent breakout. Bulls are maintaining upward pressure near resistance levels, suggesting that an upward surge could be on the horizon.

Technical indicators, particularly the Moving Average Convergence and Divergence (MACD), reveal a bullish crossover below the zero line. This crypto signal marks a shift toward upward momentum, further supporting the possibility of a market recovery in the near term.

$SPONGE (SPONGE/USD) Market Analysis: Bulls and Bears in a Dynamic Standoff
$SPONGE (SPONGE/USD) 1-Hour Chart Insights

On the 1-hour chart, recent bearish activity has increased market volatility. A sharp downside move was quickly countered by a strong bullish reaction at the $0.0000006 level, demonstrating the bulls’ presence and resolve. This swift rebound underscores their active engagement in the market.

By sustaining pressure on bearish zones, bulls are laying the groundwork for a breakout. Should this materialize, the price could climb significantly, with a potential target around the $0.00005 resistance level.

Buy SPONGE/USD!

Join the SPONGE community and be part of the next big crypto sensation! Buy Sponge ($SPONGE) today!

$SPONGE (SPONGE/USD) Market Analysis: Bulls and Bears Locked in a Fierce Battle

The SPONGE/USD market is currently experiencing a tense battle between bullish and bearish forces, with the critical $0.000026 level emerging as a pivotal zone of contention. Recently, the bears have managed to establish and sustain a lower support at $0.0000006, reinforcing their position. They have also maintained a strong defense at the significant $0.00004 resistance level, extending their influence towards the $0.00003 price zone.

However, a resurgence of bullish momentum originating near the $0.0000006 support level is now challenging the bears’ dominance. This upward drive has pushed the price to $0.00003, where it has started to weaken bearish control and test the first major resistance level. If the market achieves a decisive breakout above the $0.00003 barrier, it could trigger further bullish momentum, potentially propelling the price towards the $0.00005 mark.

Key Market Dynamics:

  • Resistance Levels: $0.00005, $0.000055, $0.000060
  • Support Levels: $0.000020, $0.0000195, $0.000019

$SPONGE (SPONGE/USD) Market Analysis: Bulls and Bears Locked in a Fierce Battle

$SPONGE (SPONGE/USD) Technical Outlook

The market is currently consolidating around the $0.000026 support zone, characterized by a period of relative calm punctuated by occasional spikes that may signal the prelude to a significant crypto price movement in either direction. With bulls maintaining pressure near the resistance zone, the market appears poised for a potential breakout and upward surge.

Traders are closely observing the dynamics, anticipating a decisive move. Notably, an analysis of the Moving Average Convergence and Divergence (MACD) reveals a bullish crossover below the zero line, indicating the market has begun to establish upward momentum. This development reinforces the potential for a robust recovery in the near term.

$SPONGE (SPONGE/USD) Market Analysis: Bulls and Bears Locked in a Fierce Battle

$SPONGE (SPONGE/USD) 1-Hour Chart Insights

Analyzing the market from a smaller timeframe, it is evident that recent bearish activity has heightened market volatility. A swift downside movement from the current levels triggered a sharp reaction around the $0.0000006 price zone, where bullish presence remains strong. This immediate response from the bulls highlights their continued activity and resilience.

By maintaining consistent pressure on bearish zones, the bulls are positioning the SPONGE/USD market for a potential breakout. If this breakout materializes, it could drive the price upward, potentially reaching the $0.00005 level

Buy $SPONGE!

Join the SPONGE community and be part of the next big crypto sensation! Buy Sponge ($SPONGE) today!

Cardano (ADA/USDT) Eyes Potential Price Recovery Amid Growing Concerns

Cardano Long-term Analysis: Bullish 

The market for Cardano (ADA) against the Tether (USDT) has seen significant volatility in recent times, with a sharp price deepening towards $0.9872 after a prolonged uptrend a month ago.

Recently, Cardano has exhibited resilience, signaling potential for a sustained uptrend following a sharp correction in previous weeks. However, the Stochastic RSI on the chart suggests a need for further confirmation as the lines operate in the neutral position.

Currently, Cardano operates at $1.0510, having seen a 22.35% weekly increase, with over 798.44 million traded volumes.

Cardano (ADA/USDT) Eyes Potential Price Recovery Amid Growing Concerns
ADAUSDT-Weekly Chart

Technical Indicators

Major Resistance Levels: $1.0658, $1.2000, and $1.4000

Major Support Levels: $0.9700, $0.8389, and $0.7898

Cardano Technical Analysis

The analysis of Cardano against the Tether shows potential signs of peak recovery, with the formation of a long-wick bullish candlestick, signaling strong buying pressure. Moreover, the Guppy Multiple Moving Averages (GMMAs) seem to diverge upward, signaling more momentum is needed for a sustained recovery.

However, the recent bearish crossover of the Stochastic RSI suggests caution, as further downside movement of the lines could lead to a short-term pullback.

To this end, with an increasing trading volume and the candlestick formation, a sustained bullish pressure above $1.0658 is expected to materialize. However, caution is needed as the oscillator signals a pullback might be around the corner.

ADA/USDT Analysis: What’s Next?

On the daily timeframe, ADA/USDT has recorded a gain of 9.47% highlighting strong bullish momentum and increased buying interest. This is further reinforced by the current bullish crossover of the EMAs, with buyers dominating the market.

However, the oscillator at the bottom indicates an extreme uptrend, which can be later translated to potential exhaustion of the current trend in the near term.

To this end, a price movement above the previous high at $1.0658 could open the path to $1.2000. Conversely, a waned buying pressure could cause the price to break below $0.9887 due to the overbought condition.

Cardano (ADA/USDT) Eyes Potential Price Recovery Amid Growing Concerns
ADAUSDT-Daily Chart


You can purchase crypto coins here. Buy LBlock

Solana’s Dapps Revenue Hits Record $365 Million

November witnessed a remarkable surge in Solana’s decentralized applications (dapps), culminating in an all-time high of $365 million in total revenue. This unprecedented achievement underscores the burgeoning strength of Solana’s ecosystem, with app revenue significantly outpacing the network’s revenue, which stood at $92 million for the month.

This flourishing ecosystem boasts over 30 protocols generating revenue exceeding $1 million, with Pumpfun, a launchpad specializing in memecoins, emerging as a trailblazer. Pumpfun achieved a remarkable feat by surpassing the $100 million mark in monthly revenue, contributing approximately 25% to Solana’s overall app revenue.

Solana's Dapps Revenue Hits Record $365 Million

In decentralized exchanges (DEXes), Raydium reigned supreme in spot trading, generating a record-breaking $32 million, capturing 86% of the total spot DEX revenue. Meanwhile, Jupiter experienced a surge in revenue, reaching $17 million, driven by the burgeoning popularity of perpetual contracts. Phantom, a prominent wallet provider, emerged as the leading revenue generator among Jupiter’s swap API partners.

This surge in-app activity underscores Solana’s growing prominence as a hub for decentralized innovation. With a diverse range of successful protocols and a robust infrastructure, Solana is well-positioned to continue its trajectory of growth and solidify its position as a leading player in the blockchain space.

Solana’s Dapp Ecosystem Thrives, Led by Memecoin Platforms

Solana’s decentralized application (app) ecosystem experienced explosive growth in November, with total app revenue reaching an all-time high of $365 million. This surpasses the network’s revenue of $92 million, highlighting the burgeoning strength of Solana’s decentralized ecosystem.

Solana's Dapps Revenue Hits Record $365 Million

Memecoin platforms have been the driving force behind this growth, generating over $500 million in revenue year-to-date. Pumpfun and Photon have emerged as key players in this sector. Telegram bots and spot decentralized exchanges (DEXes) follow closely, contributing $300 million and $141 million, respectively.

In the lending sector, Kamino Finance has taken the lead, achieving an all-time high of $2.9 million in revenue. This revenue stream is primarily derived from interest rate spreads, loan origination fees, and liquidation penalties.

Decentralized finance (DeFi) applications remain the primary revenue driver, accounting for 83.7% of total app revenue. Wallets, infrastructure, non-fungible tokens (NFTs), and gaming contribute 9.6%, 3.4%, 2.2%, and 0.9%, respectively.

November witnessed a significant milestone for Solana’s DEX ecosystem, with monthly trade volume surpassing $100 billion. This record-breaking achievement further solidifies Solana’s position as a leading blockchain platform and fuels optimism for continued growth and innovation within its ecosystem.

Solana (SOL) Price Prediction: $180.00 Support Holds in the SOL/USDT Market

Solana (SOL) Price Prediction (January 3):

Price movement in the Solana daily market had fallen sharply toward the $185.00 support level. The market soon breached that price level and headed straight toward a more psychologically significant support level at the $180.00 mark. However, that price level seems like a strong baseline, and the market rebounded upward from there.

SOL/USDT Long-Term Trend: Bearish (Daily Chart)

Key Price Levels:

Resistance: $220.00, $240.00, $260.00

Support: $205.00, $185.00, $165.00

Solana (SOL) Price Prediction: $180.00 Support Holds in the SOL/USDT Market

Price action in the Solana daily market saw a strong upward rebound in the previous session. However, this seems to have attracted some short-selling and has resulted in a slight downward retracement in the ongoing session. Be that as it may, price action stays above most of the Moving Average (MA) curves. Also, the 20- and 100-day MA lines are approaching each other for a potential crossover below the current price level of this token. Likewise, the Stochastic Relative Strength Index (RSI) indicator lines are still rising into the oversold region.

Solana (SOL) Price Prediction: SOL/USDT May Shake Off Bearish Deflections

The Solana daily market currently presents a minor downward retracement. Nevertheless, the overall trend seems to remain bullish. The last red price candle on the daily price chart indicates that there have been some short-selling trades in the market, perhaps as a result of price action hitting a few targets. Nevertheless, the market remains above most of the MA lines on the chart.

The trajectory of the Stochastic RSI lines is also still bullishly biased and points to the fact that the overall market’s short-term trend remains bullish. Also, these lines are in the overbought region of the indicator and thus suggest that strong resistance may be near.

Solana (SOL) Price Prediction: SOL/USDT Consolidates at $205.88 (4-Hour Chart)

As noticed on the Solana daily chart, we can see that price action, as of the time of writing, has recorded a slight downward retracement. On the 4-hour chart, it can be seen that price action seems to have been oscillating more around the $205.88 price level. Consequently, this seems to have presented a strong but short-term baseline. Nevertheless, price action stays above most of the MA lines, which lie below recent price candles.

Solana (SOL) Price Prediction: $180.00 Support Holds in the SOL/USDT Market

The last price candle on this chart stands off the aforementioned support level, bringing the token to trade at $207.94. In addition, the Stochastic RSI lines can be seen delivering an upside crossover above the 80 mark of the indicator, but the lines are still moving sideways. However, should price action rise past the 200-day MA line, traders may anticipate a retracement towards the $220 price level subsequently.

Get Solana (SOL) here. Buy SOL