Eigenlayer (EIGEN/USDT) Poised for a Potential Breakout

The general market sentiment for Eigenlayer against the Tether appears to be bullish after recovering from a recent dip. However, recent setup shows that the pair is poised for a potential breakout in the near term as the price settles above the mid-Bollinger band at $3.846.

Recently, EIGEN/USDT has been trending to the North after hitting the $3.094 support level, breaking the $3.846. However, the positioning of the Bollinger bands and the oscillator beneath the chart signals the pair is at a critical juncture, with a marginal gain of 0.27%.

Currently, Eigenlayer trades at $4.131 with over 30 thousand traded volumes.

Eigenlayer (EIGEN/USDT) Poised for a Potential Breakout
EIGEN/USDT- daily chart

Technical Indicators

Major Resistance Levels: $4.600, $4.800, and $5.000

Major Support Levels: $4.000, $3.850, and $3.094

Eigenlayer Technical Analysis

The daily analysis of the Eigenlayer against the Tether shows that the pair is experiencing a pause after an uptrend as seen in the chart above. However, recent price actions around the Bollinger Bands suggest an impending breakout to either side as the bands narrow to indicate incoming volatility.

On the other hand, the Stochastic RSI, which reads extreme values in the overbought region, suggests a strong uptrend with potential short-term retracement if momentum fails to hold.

On this note, sustained bullish momentum with an increased volume could push the price toward $4.600 as the bands expand in the near term. Conversely, a breakdown below $4.000 could lead to a retest of $3.500, provided the Stochastic RSI signals a bearish crossover.

EIGEN/USDT Analysis: What’s Next?

On the 4h timeframe, EIGEN/USDT demonstrates a steady uptrend with the price rising by 0.72% above the previous trading session. However, as the price targets $4.260, the position of the narrowing bands and the Stochastic lines indicates a mixed condition.

To this end, a bullish continuation is expected with an increased momentum above the $4.260. Conversely, a retracement towards $3.661 is possible if  current $4.260 resistance level becomes too hard to break.

Eigenlayer (EIGEN/USDT) Poised for a Potential Breakout
EIGENUSDT-4H Chart


You can purchase crypto coins here. Buy LBlock

$SPONGE (SPONGE/USD) Market Analysis: Bulls and Bears Clash at the Pivotal $0.00003 Level

The SPONGE/USD market is currently in a dynamic equilibrium between bullish and bearish forces, with the critical support level shifting upward from $0.000026 to approximately $0.000027. This upward adjustment hints at a slight advantage for the bulls, suggesting a potential gain in momentum.

Previously, support was repeatedly tested near $0.0000006, reflecting a temporary period of bearish control. However, the recent rise in support to $0.000027 signals a possible turning point. This development indicates that the market may be positioning itself for a sustained upward trajectory as bullish momentum continues to build.

Key Market Dynamics:

  • Resistance Levels: $0.00005, $0.000055, $0.000060
  • Support Levels: $0.000020, $0.0000195, $0.000019

$SPONGE (SPONGE/USD) Market Analysis: Bulls and Bears Clash at the Pivotal $0.00003 Level

$SPONGE (SPONGE/USD) Technical Outlook

The SPONGE/USD market is currently consolidating around the $0.000027 zone, showing early signs of increased volatility. Bulls are beginning to capitalize on this volatility, driving the market upward. However, as the price attempts to break out, it faces significant resistance, leading to a notable expansion in the Bollinger Bands, indicative of heightened market activity.

Despite the resistance, the bulls have demonstrated their strength by slightly shifting the support level from $0.000026 to $0.000027. In response, bearish pressure has brought the market’s Relative Strength Index (RSI) back to its midpoint at the 50 level, indicating a state of equilibrium.

With the market stabilizing at this level, it appears to be gathering momentum for another potential upward surge.

$SPONGE (SPONGE/USD) Market Analysis: Bulls and Bears Clash at the Pivotal $0.00003 Level

$SPONGE (SPONGE/USD) 1-Hour Chart Insights

On a smaller timeframe, recent bearish activity has heightened market volatility in response to the sharp bullish momentum observed earlier. This volatility has led to an expansion in the Bollinger Bands, signaling increased market activity.

Despite this, the market has managed to sustain its position above the $0.00003 level, a critical threshold. Maintaining price stability above this level could solidify the market’s upward trajectory.

The bulls are persistently challenging bearish resistance, laying the groundwork for a potential breakout. Should they succeed, the market could advance toward the $0.00005 level, unlocking significant upward potential.

Buy $SPONGE!

Join the SPONGE community and be part of the next big crypto sensation! Buy Sponge ($SPONGE) today!


Chainlink (LINK/USDT) Targets More Gains Amidst Market Growing Concern

Chainlink Long-term Analysis: Bullish

The market for Chainlink against the Tether on a weekly timeframe reflects strong bullish momentum, evidenced by a recent price movement above $27.04. However, the price has seen a minor dip from the recent high in the meantime, suggesting some profit-taking actions.

Recently, Chainlink looks to be eyeing a recovery as weekly trade sees a gain of 11.35%, suggesting strong market interest as price trades above the middle Bollinger band. However, the contrary position of the Stochastic RSI shows the tendency of retracing towards the $20.00 level before potential upside movement.

Currently, Chainlink is trading at $23.34 with over 31 million traded volumes for the week.

Chainlink (LINK/USDT) Targets More Gains Amidst Market Growing Concern
LINKUSDT-Weekly Chart

Technical Indicators

Major Resistance Levels: $24.05, $27.04, and $30.00

Major Support Levels: $20.00, $15.48, and $10.00

Chainlink Technical Analysis

The analysis of Chainlink against the Tether on a weekly timeframe shows a market poised for a continued uptrend despite growing downside concerns. However, the price between the upper segment of the Bollinger band shows that the pair looks seemingly overextended.

On the other hand, the Stochastic oscillator at the bottom of the chart suggests waning momentum despite accumulated buying interest. To this end, a gain above $24.05 could trigger more upside gain; otherwise, a break below the $20.00 level could lead to the retest of the $15.48 mid-band level.

LINK/USDT Analysis: Where from Here?

On the daily timeframe, the LINK/USDT appears to be slightly down by 1.10% as the price consolidates within a tight range after the recent rally above the mid-band at $22.98. This action suggests neither the bulls nor the bears dominate the market, as indicated by the low daily trading volumes.

On the other hand, the Stochastic RSI points at possible exhaustion in bullish momentum, as the lines operate in the overbought region. However, a bearish crossover is needed to confirm this position as the indicator reads 79.18 and 68.76.

To this end, traders need to monitor price behavior around the midline and the positioning of the Stochastic line for directional bias. A close above the mid-line could signal a continuation of the trend; otherwise, a close below $22.50 could signal a correction towards $19.39 before a longer-term directional move.

Chainlink (LINK/USDT) Targets More Gains Amidst Market Growing Concern
LINKUSDT-Daily Chart


You can purchase crypto coins here. Buy LBlock

Top Trending Coins for Today, January 5: SUI, BTG, CHILLGUY, PENGU and DEGEN

The performance of today’s trending coins reflects the recovering cryptocurrency market, with the top five featured tokens showing strong gains over the past 24 hours and recent days. The new year appears to be favoring these trending markets, as many have experienced significant surges in value over the last two to three days.

The list includes a mix of memecoins and utility-driven cryptocurrencies, such as Bitcoin Gold (BTG). Bitcoin Gold, a cryptocurrency that emerged from a hard fork of Bitcoin (BTC) on October 24, 2017, was specifically designed to address Bitcoin’s limitations, particularly in terms of decentralization and mining accessibility.

Without further delay, let’s dive into today’s market analysis.
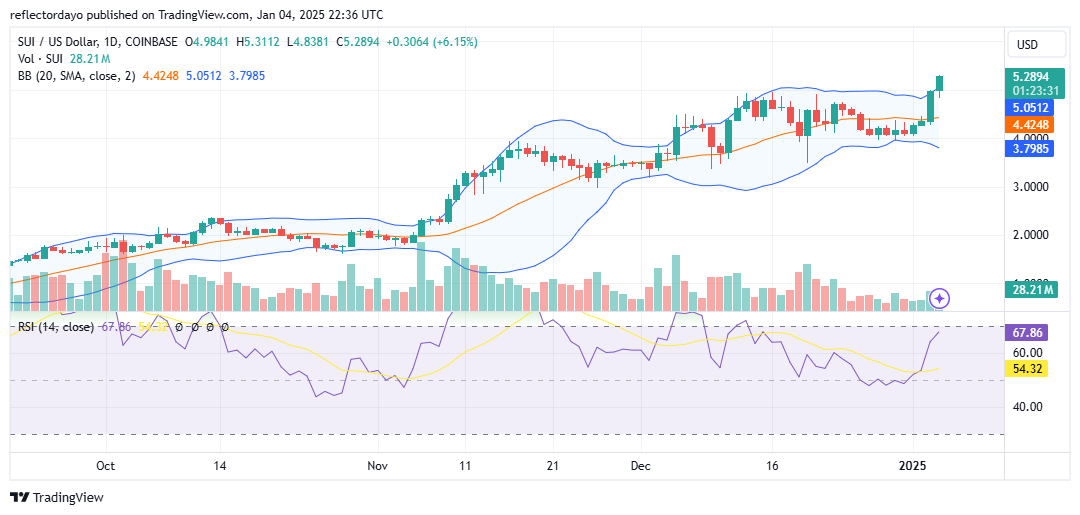
Sui (SUI)

Major Bias: Bullish

The Sui market has sustained an 8.53% gain in the past 24 hours and approximately 25% over the past few days. The new year appears favorable for the Sui market, reflecting renewed bullish sentiment.

In recent observations, the $5 price level had stood firm as a significant resistance point, leading to a consolidation trend since December 13. However, in a surprising turn of events, the market has broken above this critical level in the ongoing daily trading session. This breakout indicates that the bulls have successfully claimed this price level, maintaining the market above it.

The breach of this substantial resistance level, which had held firm for some time, is likely to trigger additional bullish momentum as traders anticipate further upward movement. Overcoming such a major barrier often signals confidence in continued growth.

However, the small histogram suggests that trading activity is decreasing, potentially due to hesitation or indecision among traders. Despite this, the bulls have established a strong hold on the $5 level, providing a solid foundation to sustain and potentially enhance the market’s upward trajectory.

Current Price: $5.27

Market Capitalization: $16 billion

Trading Volume: $2.6 million
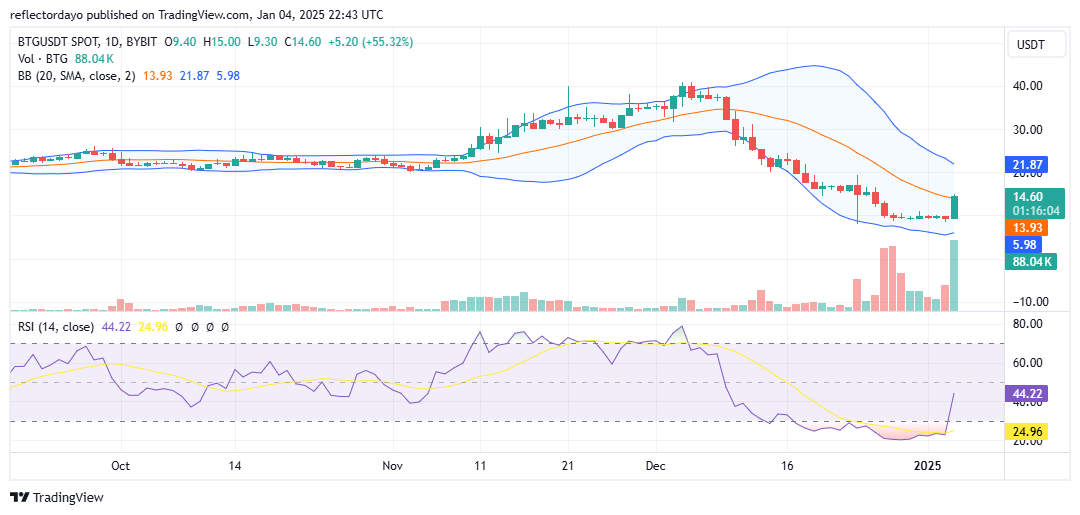
Top Trending Coins for Today, January 4: SUI, BTG, CHILLGUY, PENGU and DEGEN

Bitcoin Gold (BTG)

Major Bias: Bullish

The story of Bitcoin Gold (BTG) is one of bullish recovery following a bearish market phase that bottomed out at the $10 price level. The bear market, which began in early December, drove the price below the critical support level at $22.

Analyzing the daily chart, we observe that the bulls established a strong defense at the $10 level, creating a solid foundation during the consolidation phase. During this period, the trading volume, as indicated by the histogram, showed a notable increase. This development hinted at a potential breakout, which is now unfolding in today’s market.

Another important observation is that throughout the consolidation phase, the market remained below the 30 level on the RSI, indicating oversold conditions. These oversold conditions often signal the possibility of a bullish breakout, which appears to be materializing.

The first significant test of this recovery will be the market’s ability to break above the $17 and $20 price levels. Traders should, however, remain cautious, as some bearish sentiment may still linger despite the bullish price action. This caution is warranted due to a divergence between the price movement and the strength of the accompanying histogram.

Current Price: $13.53

Market Capitalization: $236 million

Trading Volume: $681 million

Top Trending Coins for Today, January 4: SUI, BTG, CHILLGUY, PENGU and DEGEN

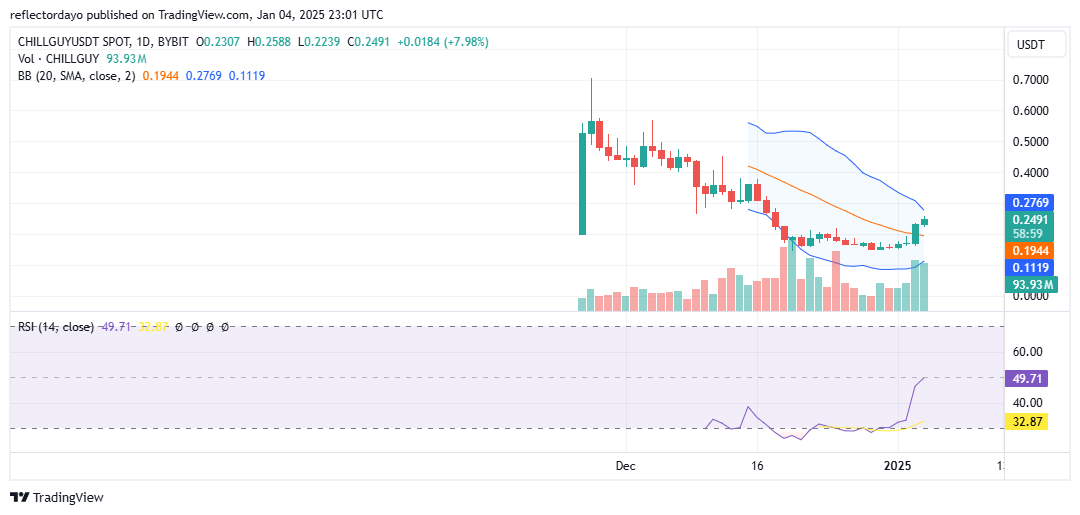
Just a chill guy (CHILLGUY)

Major Bias: Bullish

This market exhibits similar behavior to the previously discussed Bitcoin Gold (BTG) market. However, it appears to be relatively new, with historical data first appearing on the chart on November 26 at the $0.200 price level. The strong price movement observed at the time aligns with the typical behavior of newly launched markets: an initial surge that peaked at $0.70 before triggering a bear market, which has since brought the price closer to a key support level.

Currently, this market is also showing signs of recovery. It has rebounded from the $0.16 level, successfully breaking above $0.20 and maintaining its position above this critical threshold. The expectation is for the market to continue moving upward. However, the most recent trading session features a small bullish candlestick accompanied by a strong histogram, suggesting a potential slowdown in bullish momentum. This indicates the market may be approaching a significant resistance level.

Should the bulls manage to push the price beyond this resistance, the market could extend its upward movement toward the $0.300 mark.

Current Price: $0.25

Market Capitalization: $250 million

Trading Volume: $109 million

Top Trending Coins for Today, January 4: SUI, BTG, CHILLGUY, PENGU and DEGEN

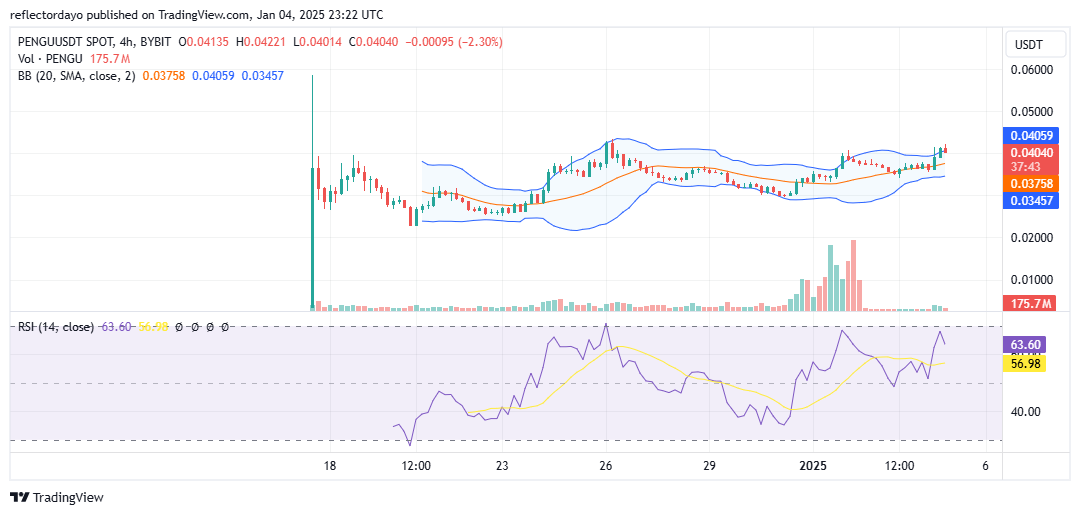
Pudgy Penguins (PENGU)

Major Bias: Bullish

The Pudgy Penguins market is relatively new, with historical data first appearing on December 17. The market initially benefited from speculative activity that drove the price to a peak near $0.06, followed by a sharp correction. Traders identified a reentry point around the $0.022 level, from which the market began a gradual upward movement, characterized by ascending lows.

A resistance level quickly emerged at $0.04, and since then, the ascending lows have steadily approached this critical supply level. This pattern reflects the increasing pressure from bulls attempting to break above the resistance, potentially paving the way for a continued upward surge.

Currently, the histogram displays minimal activity following a period of significant volume, suggesting that the market may be consolidating around the $0.04 level. This indicates an ongoing struggle between buyers and sellers at this key resistance, as the outcome of this battle will likely determine the market’s next direction.

Current Price: $0.0406

Market Capitalization: $2.6 billion

Trading Volume: $662 billion
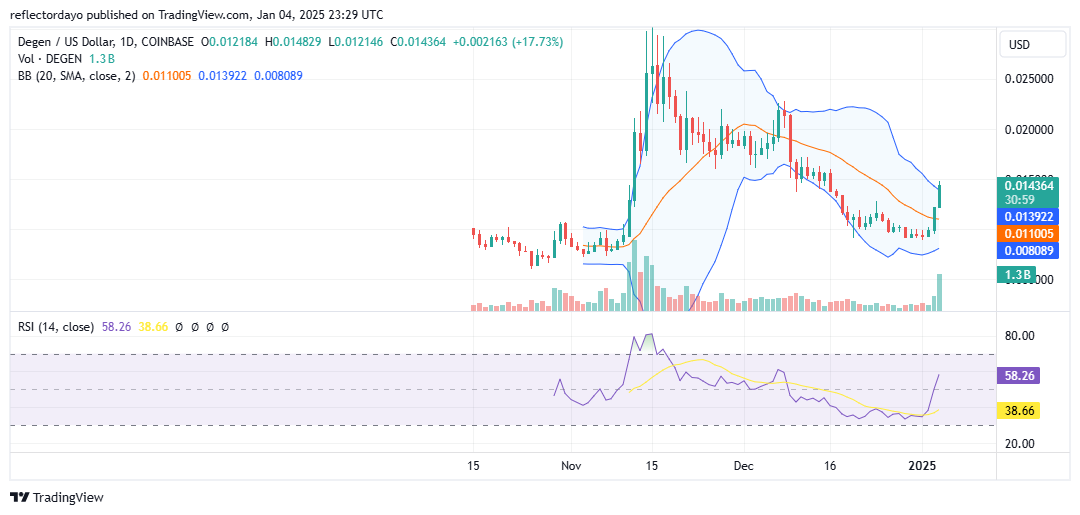
Top Trending Coins for Today, January 4: SUI, BTG, CHILLGUY, PENGU and DEGEN

Degen (DEGEN)

Major Bias: Bullish

In line with the prevailing trend in today’s market analysis, this market also presents a narrative of bullish recovery following a bear market that stalled around the $0.010 price level. Over the past 24 hours, the market has gained enough momentum to push the price upward, with the $0.015 level emerging as the next critical resistance to break in order to confirm and solidify the recovery.

However, the market is likely to encounter significant resistance at the $0.015 level due to heightened volatility. The Relative Strength Index (RSI) highlights this volatility with its steep, almost vertical ascent. This indicates that the market may face a challenge in surpassing this critical level.

The success of the bulls in breaking above $0.015 will depend on their ability to establish a nearby support level. Such a support would provide the market with the stability needed to overcome this resistance and target higher price levels.

Current Price: $0.014

Market Capitalization: $203 million

Trading Volume: $531 million

Top Trending Coins for Today, January 4: SUI, BTG, CHILLGUY, PENGU and DEGEN

Trade crypto coins on BYBIT!

Solana upgrade: Protecting Digital Money from Future Quantum Computers

Solana developers have created a special tool called the Winternitz Vault to protect digital assets from future supercomputers known as quantum computers. These computers might someday break the codes that keep digital wallets safe. However, the vault uses a clever system that changes its secret keys every time someone uses it, making it very hard for hackers to steal.

Although this vault is not for everyone yet—it’s optional. Users who want extra safety can store their digital assets in this special vault. The developers based their work on an old but strong cryptographic method, ensuring digital assets stay safe from future threats.

How the Solana Vault Works 

The Winternitz Vault keeps assets safe by changing its security keys after each transaction. Think of it like getting a brand-new credit card every time you buy something, preventing hacking, as security keeps changing.

To this end, this system uses a process called hashing, where a secret code is scrambled into a new one over and over again. Even if a hacker gets part of a code, they can’t figure out the next one because the vault starts fresh with new keys for every transaction.

Why We Need This Protection

Quantum computers are much faster than regular ones and might someday crack the codes used in digital wallets. For example, Google’s quantum computer solved a problem in seconds that would take normal computers thousands of years. Although for now, these powerful machines aren’t common, experts believe they could be in the future.

Solana upgrade: Protecting Digital Money from Future Quantum Computers

Other blockchain projects like David Chaum’s Praxxis and QAN have also worked on quantum-resistant tools. While the threat isn’t here yet, developers are working now to stay ahead. They know it’s better to prepare for a storm before it arrives.

Broader Implications

The Winternitz Vault is a step toward future-proofing blockchain technology. While quantum computers aren’t a danger today, tools like this vault show how developers are preparing for decentralized Finance (DeFi). By thinking ahead, they’re ensuring digital assets stays safe for everyone, even in a world with supercomputers.


In order to place winning trades with us via Bybit, you can open an account here.

Tamadoge (TAMA/USD): Battling for Support at $0.001

In the Tamadoge (TAMA/USD) market, bearish pressure persists, but bullish momentum remains resilient at the critical $0.001 price level. Despite strong testing by the bears, the bulls have shown determination by pushing the price back upward, striving to sustain the market above this key level as the struggle continues.

The last two trading sessions have been particularly volatile, marked by significant price swings. During this period, bears capitalized on the opportunity to test lower levels, driving the price as low as $0.0008.

Key Levels

  • Resistance: $0.0018, $0.0019, and $0.0020
  • Support: $0.001, $0.0009 and $0.0008

Tamadoge (TAMA/USD): Battling for Support at $0.001

TAMA/USD Price Analysis: The Indicators’ Point of View

In the previous analysis of the TAMA/USD market, the Bollinger Bands were observed exhibiting what is commonly referred to as a volatility squeeze. This market condition typically precedes a significant price movement.

Upon reviewing the chart, a breakout appeared likely; however, the bulls were unable to sustain the upward momentum. This crypto signal allowed the bears to gain control, pushing the price down to the $0.0008 level before traders stepped in to buy the dip.

Currently, the Relative Strength Index (RSI) indicates that the market is trading below the indicator’s midpoint, reflecting prevailing bearish strength. However, the Bollinger Bands are beginning to react to the recent sharp price movements. This suggests that the bulls have the potential to recover, enabling the market to bounce from its current levels.

Tamadoge (TAMA/USD): Battling for Support at $0.001

Tamadoge Short-Term Outlook: 1-Hour Chart

The Bollinger Bands display a divergence, signaling an increase in market volatility. However, the positioning of the price action below the 20-day moving average explains why the expanded Bollinger Bands show a slight downward tilt.

Although the price rebounded sharply from the $0.0008 level, it now appears to be consolidating as traders remain indecisive around $0.00098. This indicates that bears may have established control near the $0.001 price level. Nevertheless, given the heightened volatility, the bulls still have the potential to reclaim momentum and push the price above the $0.001 resistance level.

Buy Tamadoge!

Buy TAMA today!

Dash 2 Trade Price Predictions for Today, January 4: D2TUSD Reclaims Position above $0.00125 Level

Dash 2 Trade Price Forecast: D2TUSD Reclaims Position above $0.00125 Level (January 4)

The year 2025 has started with a notable rally for D2TUSD as it reclaims its position above the $0.00125 level, making positive moves toward the overhead resistance. If the bulls should defend the selling pressure, an increase in momentum may break up the resistance level at $0.00430 and increase the crypto price to a $0.01000 upper high trend line as the market looks to extend its gains.

Key Levels:
Resistance levels: $0.00130, $0.00135, $0.00140
Support levels: $0.000650, $0.000600, $0.000550

D2T (USD) Long-term Trend: Bullish (Daily Chart)

D2TUSD price momentum is on an upward trajectory as it reclaims position above the $0.00125 level with a bullish sentiment in its long-term perspective. The coin price is above the resistance level, proving its bullish trend.
Dash 2 Trade Price Predictions for Today, January 4: D2TUSD Reclaims Position above $0.00125 Level
The rising pressure from the bulls in the past few days has sustained the cryptocurrency price above the supply trend levels in its recent high.

However, on the daily chart today, there is a broader recovery in the prices. The Dash 2 Trade price jumped up to a $0.00126 supply level above the EMA-50 as the bulls took to their stand to resume the bullish trend.

Hence, staying above the EMA-50 indicates a strong possibility for a bullish correction. Thus, a strong breakup above the $0.00430 resistance point would strengthen the bullish pressure, as the market looks to extend its gains.

Further, if the coin buyers could hold above the $0.00430 high mark and close a candle, closing above the mentioned resistance will encourage the coin investors for a robust performance. As a result, the D2TUSD price could surge to hit the $0.0100 upper resistance value in the days ahead in its long-term outlook.

D2T (USD) Medium-term Trend: Bullish (4H Chart)

On the medium-term outlook, the D2TUSD pair witnessed a remarkable 12% increase as it reclaimed its position above the supply levels. Firstly, the crypto has broken above the moving average line, indicating a possible rise of the pair.
Dash 2 Trade Price Predictions for Today, January 4: D2TUSD Reclaims Position above $0.00125 Level
The previous action at the $0.00109 high level has sustained the coin price above the trend line in its recent high.

The bulls hit the resistance level of $0.00126 above the EMA-50 as the 4-hourly chart resumes today, indicating investors’ sparking optimism. However, the buy traders could not relent, as they aimed to drag the price further to a significant level at the upper channel.

However, the bullish correction at the mentioned resistance level indicates that the bulls are planning to strongly move the price of Dash 2 Trade to a high level at the upsides, and the $0.01000 upper high trend line might be the target in the future in its medium-term outlook.

Signal Notifications Will Be Coming Soon! Better things are on the horizon for Dash 2 Trade! Signal Notifications will ensure that you never miss a beat:

Want a coin that has a huge potential for massive returns? That coin is Dash 2 Trade. Buy D2T now.

POL (ex-MATIC) Price Prediction: POL/USDT Buyers Are Hanging on

POL (ex-MATIC) Price Prediction (January 4):

The POL (ex-MATIC) token has rebounded off a key support level formed by some technical indicators. The market has continued to move north since then, with today’s trading activity so far remaining in the green despite reduced bullish momentum.

POL/USDT Long-Term Trend: Bullish (Daily Chart)

Key Price Levels:

Resistance: $0.5500, $0.6000, $0.6500

Support: $0.5000, $0.4500, $0.4000

POL (ex-MATIC) Price Prediction: POL/USDT Buyers Are Hanging on

The POL (ex-MATIC) token saw a significant price increase in the previous session. However, the current session appears to be hotly contested by price forces. The last price candle on this chart is green but with a very small body. Nevertheless, it brings the market to stand above 3 out of the 4 Moving Average (MA) lines. Also, the Stochastic RSI lines have risen considerably into the overbought region with such a moderate price movement.

POL (ex-MATIC) Price Prediction: POL/USDT Bulls May Get Exhausted Soon

The POL (ex-MATIC) market has seen a moderate recovery since its price action rebounded off the 100-day MA line as support. The momentum had heightened in the previous session as the market charged through the $0.5000 resistance level.

The current session has remained in the green even though the current price candle suggests that upside forces are currently facing strong resistance. Yet, the position of price activity above most of the MA lines and the upward trajectory of the RSI indicator lines maintain the opinion that price action may continue to move slightly higher in subsequent sessions.

POL (ex-MATIC) Price Prediction: POL/USDT Consolidates but Seems to Hold Promise (4-Hour Chart)

Price action in the POL (ex-MATIC) 4-hour market can be seen consolidating sideways in what appears to be a narrow range. Although the last and the previous price candles are green. Meanwhile, the 20- and 100-day MA lines are seen crossing below price action while the RSI lines are moving sideways at approximately the 100 level of the indicator.

POL (ex-MATIC) Price Prediction: POL/USDT Buyers Are Hanging on

Indications arising from this market seem a bit ambiguous. The consolidative move of price action suggests that there is a strong struggle between buyers and sellers. However, the crossover of the 20- and 100-day MA lines suggests that upside forces may receive a boost since the RSI lines linger in the overbought region. At least, traders can take a fair target at the $0.5500 price mark.

Get POL (ex-MATIC) here. Buy POL

Bitcoin’s Rollercoaster: Will Political Shifts Spark a Historic Bitcoin Rebound?

Bitcoin has fallen to $92,118 in the last three days from its peak of $108,364, but investors are now questioning the coin’s future because of this steep decline, which coincides with escalating political tensions in the United States and heightened market uncertainty due to an upcoming government shutdown.

Notwithstanding the current challenges, several observers believe this might lead to Bitcoin’s most significant resurgence. Investors are thus watching for signs of a recovery, and the volatility of the cryptocurrency market reflects the political environment.

To this end, Donald Trump’s return to the presidency has sparked speculation about crypto-friendly policies that could reignite Bitcoin’s growth. However, some crypto experts warn of a prolonged downturn for the digital asset.

Trump’s Potential Influence on Bitcoin

It is not new that many crypto enthusiasts believe that Trump’s policies if they are Bitcoin-supportive, could create the much-expected bullish wave. Moreover, a U.S. strategic Bitcoin reserve has been floated as a game-changer that could drive institutional and retail interest.

Bitcoin’s Rollercoaster: Will Political Shifts Spark a Historic Bitcoin Rebound?

They believe such measures might trigger what the community calls a “God candle,” a massive one-day price spike that sets new records. Optimists believe that if the government adopts blockchain technology, this is a genuine possibility.

However, doubters like BitMEX’s previous CEO, Arthur Hayes, are still wary. Hayes forecasts a brief market decline brought on by political and economic unrest. Martin Shkreli has also expressed worries about Bitcoin lingering in one place. This implies that Michael Saylor’s Microstrategy may have to go through liquidation as Bitcoin endures years of a sluggish recovery.

However, as demonstrated by the S&P 500’s historic sporadic increase, these divergent opinions highlight the uncertainties surrounding Bitcoin’s future under the new Trump administration.

Current Market Trends and Investor Sentiment

The markets may stabilize and provide the groundwork for Bitcoin’s rebound once the U.S. overcomes its budgetary problems. Although crypto markets have historically reacted erratically to shifts in the macroeconomy, there is still hope for a future recovery.

But skepticism of individuals like Shkreli serves as a cautionary tale. The coin’s recent drop points to a downward trend that may yet offer opportunities.

Despite the excitement surrounding potential political developments, market and broader adoption patterns will have a huge impact on Bitcoin’s destiny. Investors are reminded of the need of maintaining a broad portfolio at this period of heightened volatility. It shows that while future political changes could boost the economy, they also come with serious risks.


In order to place winning trades with us via Bybit, you can open an account here.