Pudgy Penguins (PENGU/USD): Making Waves in the Crypto Market

Pudgy Penguins is a collection of 8,888 unique, hand-drawn penguin-themed NFTs launched on the Ethereum blockchain in mid-2021. Each penguin possesses distinct traits, making them one-of-a-kind digital collectibles.

The Pudgy Penguins NFT collection was launched back in 2021 on the Ethereum blockchain. It quickly gained popularity as a unique digital collectible project. However, the PENGU token, which is associated with the Pudgy Penguins ecosystem, was launched more recently, in December 2024.

As of January 5, 2025, the native token, PENGU, experienced a 13% increase, trading at $0.040. This marks a 250% surge since its launch on December 17, 2024. The market just surged above the $0.04 price level; though currently correcting downwards, it may likely sustain above this critical price level.

Pudgy Penguins Market Data

  • PENGU/USD Price Now: $0.044
  • PENGU/USD Market Cap: $2.82 billion
  • PENGU/USD Circulating Supply: 62.8 billion PENGU
  • PENGU/USD Total Supply: 88.9 billion PENGU
  • PENGU/USD CoinMarketCap Ranking: #50

Pudgy Penguins (PENGU/USD): Making Waves in the Crypto Market

Key Levels

  • Resistance: $0.045, $0.050, and $0.055
  • Support: $0.040, $0.035, and $0.030.

Pudgy Penguins Through the Lens of Indicators

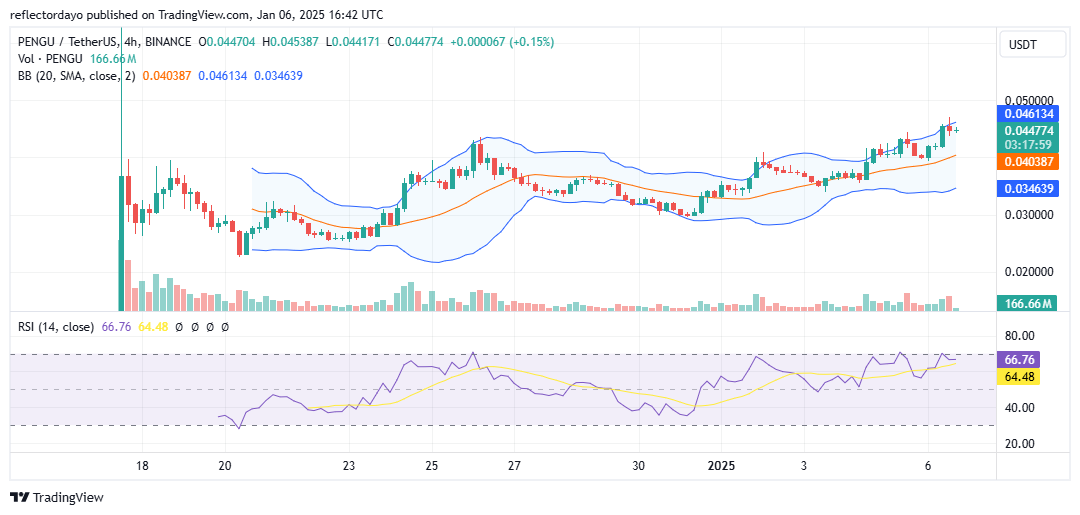
The market is demonstrating a clear bullish trend, as evidenced by the emergence of higher lows, also known as ascending lows. Notably, the $0.040 price level served as a significant resistance for an extended period until the bulls managed to break above it. This breakout, which had been anticipated for some time, was expected to generate substantial bullish momentum capable of propelling the market further upward.

However, just above this critical level and near the $0.046 price point, traders exhibited caution, leading to a slight pullback. Despite this correction, the retracement lacked significant strength. Some investors appear to have retreated to the $0.040 support level, potentially intending to re-enter the market from this position.

A rebound from this level could reinforce bullish sentiment, potentially driving the market toward another breakout above the $0.046 resistance. The ability to break and sustain above the $0.040 level is a notable accomplishment for the bulls, underscoring the market’s progression in a bullish trajectory.

Pudgy Penguins (PENGU/USD): Making Waves in the Crypto Market

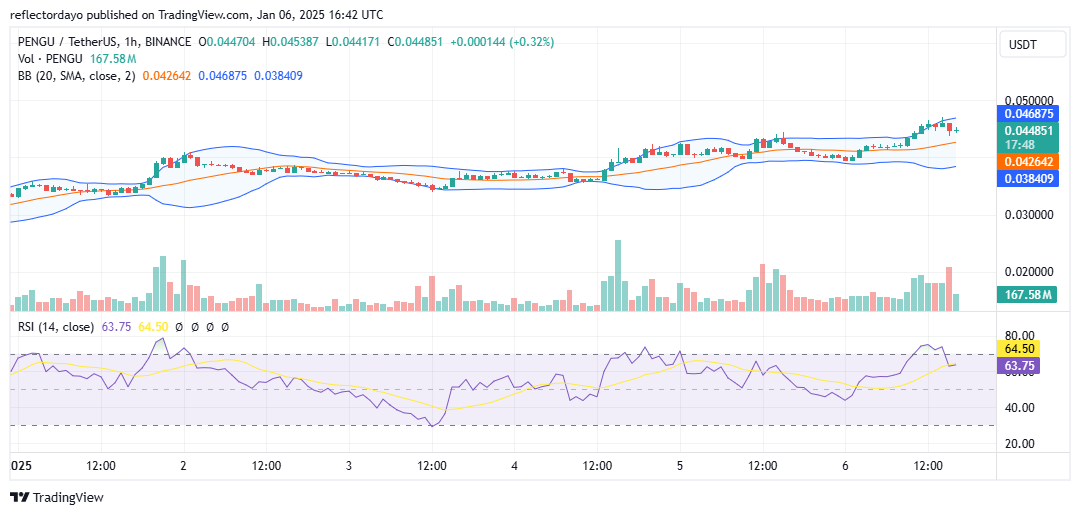
PENGU/USD Price Prediction: 1-Hour Chart Analysis

On the 1-hour chart, the market shows signs of consolidation around the $0.040 price level, a trend that has persisted for some time. Recently, there was an attempt to break out of this range, causing the Bollinger Bands to slightly expand. However, as traders approached the $0.046 resistance level with caution, the market has reverted to a consolidation phase near the critical $0.040 level.

There is a strong likelihood of a rebound once the price touches this key support level. This crypto signal is supported by the price action—specifically, the formation of two bearish candlesticks—which indicates a weakening bearish momentum as the price nears $0.040. This could also suggest that the market is positioning itself for a bounce at a level slightly higher than $0.040.

A rebound at this support level would reaffirm the continuation of the bullish trend, with a potential move toward higher price levels, particularly above $0.046. The PENGU market continues to exhibit steady bullish momentum, maintaining an ideal setup for sustaining its upward trajectory.

Trade crypto coins on BYBIT!

The Crypto Crystal Ball: 2025

The crypto market is a place where one can make huge profit and as well loose huge amount of money in a second. It’s a playground for the bold and a rollercoaster for the risk-tolerant.

You’ve witnessed the frenzy, the FOMO, and the rise of memecoins like FartCoin. But what does the future hold?

While pundits peddle their predictions, let’s peer into the crystal ball ourselves.

The Crypto Crystal Ball: 2025

Prepare for Volatility

Many believe Bitcoin is maturing, its wild swings are a thing of the past.

Perhaps.

But 2025 will still be a year of exhilarating highs and terrifying lows. Bitcoin will likely reach heights we can barely imagine today.

But remember, it’s Bitcoin. Expect the unexpected. Hold on tight.

Memecoin Mania: Proceed with Caution

The memecoin space will be a wild west of volatility.

Expect 90% price drops to become common.

This is not for the faint of heart.

The FartCoin Fizzles: Memecoin Mania May Be Over

Memecoins have captivated the crypto world. FartCoin, for example, recently achieved a staggering $1 billion market cap.

The Crypto Crystal Ball: 2025

But I believe we’ve entered the twilight of the memecoin era.

FartCoin, celebrity-endorsed tokens, AI-themed coins, and animal-themed coins—these novelty tokens will likely struggle to keep pace with utility coins.

Utility coins, with their real-world applications, user bases, and solutions, are poised to take center stage.

We’re already witnessing this shift. Memecoin trading volume has plummeted from 30% earlier this year to roughly half of that today.

This trend is likely to continue.

This leads to the next prediction:

Is the Next Trillionaire a Crypto Whale?
Source: create.vista.come

DeFi 3.0: Turbocharging Governance Tokens

Governance tokens have often been overlooked, even dismissed as underperformers.

These cryptocurrencies empower holders with voting rights on critical decisions within a blockchain project, such as protocol upgrades, treasury management, and policy changes.1

However, regulatory uncertainty has stifled their growth.

But the tide is turning. As regulatory clarity emerges, DeFi projects are poised to reignite interest in governance tokens.

Envision a future where yield generation is seamlessly integrated into tokenomics, AI-powered Decentralized Autonomous Organizations (DAOs) manage protocols with unparalleled efficiency, and users rediscover the true ownership of the networks they participate in.

This vision has the potential to not only revitalize governance tokens but also dispel the misguided notion that “DeFi is dead.” The AI Agent Coin Frenzy: Hype vs. Reality

Expect AI agents to dominate crypto headlines soon—likely around February, as many projects with real-world utility gain traction.

But proceed with caution. Hype will undoubtedly precede substance.

Many projects will promise AI-powered Web3 revolutions yet deliver little beyond eloquently written white papers (likely penned by ChatGPT itself).

However, amidst the noise, a few “ChatGPTs of crypto” will emerge as dominant players, garnering widespread adoption.

Coinbase: The Crypto Establishment

Coinbase will solidify its position as the industry standard, navigate regulations, and attract institutional capital. Expect continued growth for COIN stock.

Bitcoin L2s: Overhyped and Overrated

The constant hype surrounding Bitcoin Layer 2s is tiresome. This narrative resurfaces year after year, but I remain unconvinced. Don’t expect an L2 revolution in 2025.

Brace for Impact

2025 promises both chaos and unprecedented opportunities. Embrace the turbulence—fortunes favor the bold. This market isn’t for the timid, but for those who dare to thrive. And if FartCoin somehow reaches a $10 billion valuation, well, I’ll forever lament my missed opportunity.

Dash 2 Trade Price Prediction for Today, January 6: D2TUSD Price Rises, Retarding Negativities

Dash 2 Trade Price Forecast: D2TUSD Price Rises, Retarding Negativities (January 6)

D2TUSD price rises while retarding negativities to kick start a parabolic rally that could push the token to a higher level. The coin may likely increase further if the bulls could add more strength to their potential buying and the market price sustains above the $0.00430 high point, the potential rally could surge above the $0.00430 higher level to hit the $0.01000 upper resistance value and beyond, confirming a bullish breakout and a bull flag pattern.

Key Levels:
Resistance levels: $0.00139, $0.00140, $0.00141
Support levels: $0.00780, $0.000770, $0.000760

D2T (USD) Long-term Trend: Bullish (Daily Chart)

Dash 2 Trade price actions over the past few days have created a bull flag pattern as it rises, retarding the negative moves in its higher time outlook. The price is trading in a bullish momentum, indicating the high impact of the long traders.
Dash 2 Trade Price Prediction for Today, January 6: D2TUSD Price Rises, Retarding Negativities
In the previous actions, the coin has been having high interference from buyers which made it easier for the cryptocurrency to maintain a stable upside moves in its recent high.

The D2TUSD price breakout at the $0.00138 resistance value above the EMA-50 as the daily chart opens today indicates the token is rising while retarding the negative impacts, resulting in intraday gains.

Based on the outlook, if the bulls can speed up their buying activities and close above the $0.00430 high mark, a bullish breakout confirmation will reflect the improved market sentiment.

Similarly, the underlying sentiment suggests an uptrend continuation in the coming days as indicated by the daily stochastic.

It is expected that buyers will push the price of D2TUSD further up to a significant level in the upsides. In this case, the target might be the $0.01000 upper resistance level in the coming days, suggesting a good entry point for buyers in the higher time frame.

D2T (USD) Medium-term Trend: Bullish (4H Chart)

On the medium-term time frame, prices of D2TUSD are above the moving averages and have confirmed a bullish momentum breaking the previous high at $0.00127. The pair is in a smooth uptrend as can be seen from the chart below.
Dash 2 Trade Price Prediction for Today, January 6: D2TUSD Price Rises, Retarding Negativities
The bullish reversal at the $0.00127 high value in the previous action has sustained the crypto above the supply trend lines in its recent high.

Today, the Dash 2 Trade price rises significantly above the resistance trend lines at the $0.00138 level as the 4-hourly chart begins, due to a bullish impact on the market price.

The recovery rally is advancing towards the upper channel, signaling a possible bullish breakout and continuation, to retest the $0.00265 previous barrier, as it continues its journey up north.

Hence, Dash 2 Trade is showing more upside possibility as indicated by the daily stochastic, pointing in an upward direction.

More gains and strength from the coin are certain as the bulls continue to dictate the market conditions. As a result, the pair may reach the $0.01000 resistance level in the days ahead in its medium-term perspective.

The best crypto analytics and social trading tool is Dash 2 Trade, which was created to assist you in making quicker, more informed, and more lucrative decisions in the cryptocurrency market.

📈 Dash 2 Trade is the ultimate crypto analytics and social trading platform designed to help you make smarter, faster, and more profitable decisions in the crypto market.


Here’s what we offer:
✅ Real-Time Trading Signals: Never miss an opportunity with buy/sell alerts backed… pic.twitter.com/NXw0v3n1AS

— Dash 2 Trade (@dash2_trade) December 24, 2024

Want a coin that has a huge potential for massive returns? That coin is Dash 2 Trade. Buy D2T now.

Compound (COMPUSD) Undergoes a Bullish Reversal

Price Analysis: COMPUSD Experiences a Strong Bullish Rally to a Corrective Phase 

In November 2024, COMP/USD experienced a notable bullish trend, originating from the $38.90 demand level. This upward momentum sustained itself until early December 2024, peaking at $139.80 before reversing into a corrective phase.

COMPUSD Key Levels

Demand Levels: $69.10, $52.70
Supply Levels: $91.60, $114.60

Compound (COMPUSD) Undergoes a Bullish Reversal

The subsequent decline saw the price fall below the $91.60 supply level, supported by the daily Moving Average. However, despite the bearish momentum, the demand levels remained resilient, preventing a deeper pullback. This stability signaled a renewed bullish interest as the price began trending upward once again.

A critical indicator of this resurgence is the daily Relative Strength Index (RSI), which reflects a strengthening bullish momentum. Although the price has only slightly moved above the daily Moving Average, this behavior aligns with the early stages of a bullish reversal. On the 4-hour timeframe, a closer view reveals a decisive breach of the trendline resistance, further confirmed by the formation of a reverse head-and-shoulders pattern—a classic indicator of a bullish continuation bias.

Compound (COMPUSD) Undergoes a Bullish Reversal

Market Expectation

The current market price action suggests a high probability of COMP/USD breaching the $91.60 supply level in the coming sessions. The rising RSI on the daily chart underscores this expectation, pointing to the potential for a sustained bullish movement as the price targets the previous high of $139.80.

You can purchase Lucky Block here.  Buy LBLOCK

Note: Cryptosignals.org is not a financial advisor. Do your research before investing your funds in any financial asset or presented product or event. We are not responsible for your investing results

Internet Computer (ICP/USD) Market Signals Bullish Prospects With Strengthening Momentum

Internet Computer Price Prediction – January 5

ICPUSD market signals bullish prospects with strengthening momentum. The market is experiencing a surge in buying interest, as reflected in recent price activity. Technical tools like the 9-day Simple Moving Average (SMA) and the Moving Average Convergence Divergence (MACD) point to a strong upward trajectory for ICPUSD. The asset’s price, currently positioned above the SMA at $10.400, indicates a clear bullish direction. Additionally, the MACD histogram has transitioned into positive levels, while the MACD line has moved above the signal line. These developments highlight increasing market demand, underscoring the likelihood of sustained upward momentum.

ICP/USD Market Key Levels:

Resistance levels: $16.280, $17.990, $20.960
Support levels: $10.050, $6.800, $4.960

ICP/USD – Daily Chart

The ICP/USD daily chart shows that the market is now reversing to the upside.

The chart shows a clear breakout from the $10.050 level, which has now turned into support. A rising trendline offers additional support, beginning from the December lows near $10.040.

The price action formed a consolidation box between $10.040 and $10.530 before breaking upward. This breakout aligns with increased volume and momentum, signaling the possibility of a sustained bullish move.

Internet Computer (ICP/USD) Market Signals Bullish Prospects With Strengthening Momentum

What is the projection for the ICPUSD market?

The projection for ICPUSD is optimistic, with the next major resistance level at $12.000. If bullish momentum continues, the price could test the $16.280 level, representing a significant upside. However, a pullback to retest the $10.530 support level could occur before further upward movement.

Internet Computer (ICP/USD) Market Signals Bullish Prospects With Strengthening Momentum

ICP/BTC Price Analysis

The ICPBTC pair has experienced a bullish breakout from the descending trendline, with the price now positioned above the 9-day simple moving average at 0.0001100 BTC. Additionally, the MACD histogram is showing a positive turn, and the MACD line has crossed above the signal line, indicating a strengthening bullish momentum.

A strong support zone is established around 0.0001060 BTC, with resistance levels at 0.0001180 BTC and 0.0001520 BTC. A potential pullback to retest 0.0001100 BTC as support could precede further upward movement toward 0.0001629 BTC.

Internet Computer (ICP) Current Statistics
The current price: $10.050
Market Capitalisation: $5,790,000,000
Trading Volume: $173,960,000

Place winning ICP trades with us. Get ICP here

Near Protocol (NEAR/USD) Market Signals Strong Bullish Momentum on Technical Indicators

Near Protocol Price Forecast – January 3

Near Protocol (NEARUSD) market signals strong bullish momentum on technical indicators. The recent formation of the bullish marubozu candlesticks also signals bullish momentum.

The NEARUSD chart reveals bullish momentum supported by several indicators. The price is trading above the 9-day Simple Moving Average (SMA) at $5.210, confirming an upward trend. Additionally, the Stochastic oscillator is overbought, with the %K line at 91.18, indicating strong buying pressure. This suggests that bulls are dominating the market.

NEAR/USD Market Key Levels:

Resistance levels: $6.490, $8.520, $10.000
Support levels: $4.300, $3.070, $2.450

Near Protocol (NEAR/USD) Market Signals Strong Bullish Momentum on Technical Indicators

NEAR/USD – Daily Chart

The daily chart for NEARUSD shows an increase in the market’s buying pressure.

Price action highlights a series of higher lows and higher highs, confirming the bullish trend. The recent bounce from the $4.300 support level indicates strong buyer interest, propelling the price above the key Fibonacci retracement levels of 0.618 at $5.310 and 0.5 at $5.830.

The breakout above $5.500 signals further strength, with the resistance level at $6.490 as the next target. Notably, the candlesticks show bullish dominance, with no significant signs of reversal.

What is the outlook of NEARUSD?

Looking forward, NEARUSD is likely to continue its upward trajectory. If the price surpasses the $6.490 resistance, it could aim for the $7.330 and $8.520 levels in the near term, with a long-term target of $10.000.

However, if bearish pressure emerges, the $4.300 level could serve as a strong support zone. The overall market sentiment remains bullish, favoring continued gains for NEARUSD.

Near Protocol (NEAR/USD) Market Signals Strong Bullish Momentum on Technical Indicators

NEAR/BTC Price Analysis

NEARBTC is showing bullish momentum as the price continues to rise above the ascending trendline, with the current value at 0.00005830 BTC. The price is trading above the 9-day SMA at 0.00005610 BTC, indicating sustained upward movement.

The Stochastic oscillator is trending upward, with the %K line at 77.66, reflecting increasing buying pressure. A breakout above the resistance zone at 0.00006170 BTC could lead to further gains toward the 0.00007000 BTC and 0.00008400 BTC levels.

Near Protocol (NEAR) Current Statistics
Current price: $5.620
Market Capitalization: $6,720,000,000
Trading Volume: $333,510,000

Place winning NEAR/USD trades with us. Get NEAR here

Dogecoin Price Prediction: DOGE/USDT Is Regaining Liveliness

Dogecoin Price Prediction (January 6):

The Dogecoin token is now bursting into vibrant colors. The token has just broken through the $0.3000 resistance. This is a price level below which price action has consolidated for more than two weeks. Currently, the market now trades above important technical landmarks.

DOGE/USDT Long-Term Trend: Bullish (Daily Chart)

Key Price Levels:

Resistance: $0.4000, $0.4500, $0.5000

Support: $0.3500, $0.3000, $0.2500

Dogecoin Price Prediction: DOGE/USDT Is Regaining Liveliness

The ongoing session in the Dogecoin stands just above all the Moving Average (MA) lines. Also, the mentioned price candle appears green while sitting just atop the 50-day MA line. More recently, the price candle seems confined between the $0.4000 price level and the 50-day MA line. At the same time, the Stochastic Relative Strength Index (RSI) lines are still in the overbought region of the indicator. However, the mentioned indicator lines can be seen falling slightly downward following a crossover there.

Dogecoin Price Prediction: DOGE/USDT Maintaining an Elevated Support

Price action in the Dogecoin daily market has moved on to a higher Support level. As can be seen, price action in the market has been above the 50-day MA line. As a result, price action has been oscillating within the narrow range formed by the 50-day MA line and the $0.4000 price level. The mentioned line is the most elevated line of the MA lines.

Meanwhile, the Stochastic RSI lines are still in the overbought region. Also, the ensuing lines of the indicator are falling slightly downward towards the 80 mark of the indicator. Nevertheless, the last price candle on this chart suggests that the market may have found strong support at the 50-day MA line.

Dogecoin Price Prediction: DOGE/USDT Seems Prepared to Retest the $0.4000 Mark (4-Hour Chart)

Price activity in the Dogecoin 4-hour market remains above all the MA lines. However, the appearing price candle has a small body and, as such, portrays that price forces are contending against each other. Also, the 20- and 200-day MA lines have delivered a crossover recently below price actions. Simultaneously, the Stochastic RSI indicator lines are now in the oversold region but have performed a bullish crossover there.

Dogecoin Price Prediction: DOGE/USDT Is Regaining Liveliness

Summing up indications from technical indicators as well as price movements, it could be deduced that upside forces have a fair chance of approaching the $0.4000 price level. The position of the lines of the RSI lines suggests that upside forces may have enough room to cause considerable price increases in subsequent sessions. Therefore, traders can aim at the $0.4200 mark in this market.

Get Dogecoin here. Buy DOGE 

Bitcoin (BTC/USD) Market Resumes Bullish Momentum With Strong Indicators

Bitcoin Price Prediction – January 2

Bitcoin market resumes bullish momentum with strong indicators. Following the sell-side liquidity grab, the market has shown signs of resumption of its bullish trend.

The BTCUSD pair is signaling renewed bullish momentum, as evidenced by the 9-day Simple Moving Average (SMA), which currently trends upward and serves as dynamic support around $94,700. The Stochastic Oscillator indicates an upward crossover near the 50 level, reflecting increasing bullish momentum and suggesting a potential move toward overbought conditions.

BTC/USD Market Key Levels:

Resistance Levels: $100,000, $108,390, $115,000
Support Levels: $90,000, $73,840, $66,780

Bitcoin (BTC/USD) Market Resumes Bullish Momentum With Strong Indicators

BTC/USD – Daily Chart

The BTCUSD daily chart shows signs of a bullish trend continuation.

Analyzing price action, BTCUSD has successfully defended weak support near $92,120, forming a swing low. The market has rebounded strongly from this level, reclaiming the $96,000 zone and aiming to challenge the psychological $100,000 resistance. The ascending trendline and higher lows highlight the continuation of the bullish structure observed since November.

What is the likely projection of BTCUSD?

Projection-wise, BTCUSD will likely break above $100,000 in the near term, targeting $108,390 and eventually $115,000 as momentum builds. Bulls appear poised to dominate, provided key supports remain intact.

BTC/USD – Four-Hour Chart

Bitcoin (BTC/USD) Market Resumes Bullish Momentum With Strong IndicatorsBTCUSD is showing early bullish momentum, with the price trading above the 9-period SMA at $96,380, which acts as dynamic support. The breakout above the previous and the creation of a major structure shift (MSS) confirm bullish intent.

The stochastic Oscillator near 76 signals overbought conditions, suggesting potential consolidation or pullback. Key resistance at $100,000 remains the next target, while support lies at $90,000.

Bitcoin (BTC) Current Statistics
The current price: $96,470
Market Capitalization: $1,940,000,000,000
Trading Volume: $35,980,000,000

You can purchase Bitcoin here. Buy BTC

BNB (BNB/USDT) Gearing Up for More Upside Movement

BNB Long-term Analysis: Bullish

BNB against the Tether has been exhibiting a gradual trajectory recently, holding above support levels and pushing towards higher resistance lines. The market has been showing signs of bullish momentum, supported by positive gains as seen in the formation of higher highs.

However, as BNB/USDT trends upward, recent price actions suggest continued upside movement as the price settles above the green Guppy Multiple Moving Averages (GMMAs), characterized by a noticeable gap within the two sets of Exponential Moving Averages (EMAs).

This action indicates a growing bullish momentum as the line behavior of the Stochastic RSI signals more improvement to the North.

Currently, BNB trades at $713.61, recording over 16 thousand traded volumes and a marginal weekly gain of 0.61% over the previous session.

BNB (BNB/USDT) Gearing Up for More Upside Movement
BNBUSDT-Weekly Chart

Technical Indicators

Major Resistance Levels: $714.80, $750.00, and $780.00

Major Support Levels: $705.72, $698.02, and $675.82

BNB Technical Analysis 

On the weekly timeframe, BNB against the Tether maintains a positive long-term outlook as price trends higher, reflecting increasing bullish support after every short-term price dip. However, the present setup suggests caution as the price of the pair trades above the GMMAs, signaling an overbought condition. Therefore, a pullback towards $705.72 before further gains aligns with the overall trend.

On the other hand, the Stochastic RSI suggests a neutral position for the pair. This signals more room for improvement but hints at a potential consolidation in the near term. However, a retracement towards $698.02 might be on the horizon if a bearish crossover of the lines occurs.

BNB/USDT Analysis: What’s Happening?

On the daily timeframe, BNB/USDT oscillates around the short-term EMAs, suggesting a consolidation phase as the market awaits a clearer sign. The position of the GMMAs, though aligns with the continuation of a bullish momentum with upside well-separated lines. However, as the price trades between $710 and $714 support and resistance levels, a sustained bullish momentum will push the price above the latter; otherwise, a break below $710 could lead to a retest of the $700 psychological level.

On the other hand, the oscillator indicates potential bearish momentum in the short term as the orange line crosses over the blue line. To this end, a pullback may occur unless momentum is strengthened. Therefore, if selling pressure increases, as indicated by the downward-facing oscillator, BNB/USDT could retest the $700 psychological level.

BNB (BNB/USDT) Gearing Up for More Upside Movement
BNBUSDT-Daily Chart


You can purchase crypto coins here. Buy LBlock