Tamadoge (TAMA/USD): Bulls Eye a Comeback Below $0.001 – Is It the Perfect Buy-the-Dip Opportunity?

The Tamadoge (TAMA/USD) market has recently faced intense bearish pressure, resulting in a breakdown below the critical $0.001 price level. On January 5, the bears gained significant control, leveraging the downward momentum to push the market further below this threshold. However, after reaching a low of $0.000857, the bearish momentum appears to have been rejected. This dip presents a strategic opportunity for traders to buy at a discount, potentially triggering a price rally that could reclaim the $0.001 level and even break above it.

Key Levels

  • Resistance: $0.0018, $0.0019, and $0.0020
  • Support: $0.001, $0.0009 and $0.0008

Tamadoge (TAMA/USD): Bulls Eye a Comeback Below $0.001 – Is It the Perfect Buy-the-Dip Opportunity?

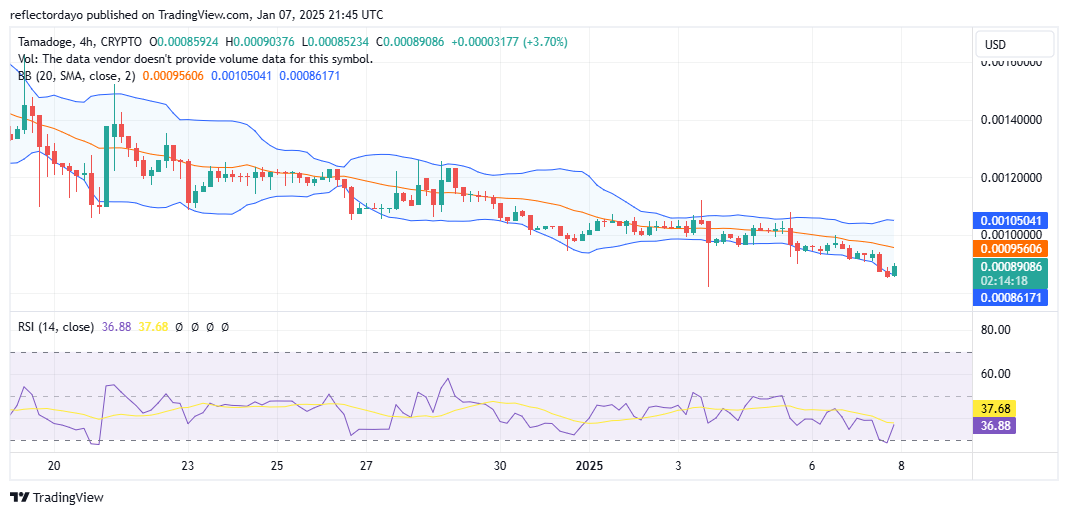
TAMA/USD Price Analysis: The Indicators’ Point of View

The dip below the $0.001 price level presents an excellent opportunity for Tamadoge traders to buy at a favorable price. The bulls seem to have established strong support at the $0.00085 level, which is aiding the market’s recovery. Currently, the crypto signal is in a rebound phase, as evidenced by the formation of a bullish candlestick. However, the candlestick’s upper shadow indicates the presence of bearish resistance within the ongoing recovery. While the market shows signs of recovery, it remains under bearish pressure. Increased bullish momentum will be required to drive the price back to the $0.001 level and reclaim the lost ground.

Tamadoge (TAMA/USD): Bulls Eye a Comeback Below $0.001 – Is It the Perfect Buy-the-Dip Opportunity?

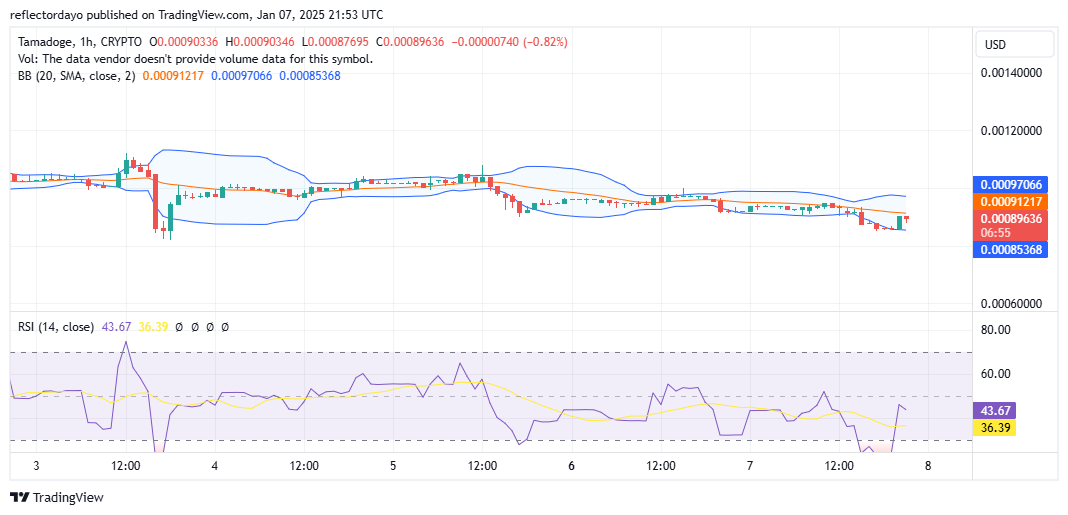
Tamadoge Short-Term Outlook: 1-Hour Chart

A closer look at the 1-hour chart reveals a continuation of bullish momentum in the market. Initially, a Marubozu candlestick signaled a strong upward movement, pushing the price from around $0.00085 to the $0.0009 level. A brief dip caused by profit-taking was quickly countered by bullish activity, leading to the formation of a hammer candlestick pattern—an indicator of renewed bullish pressure. A breakout above the $0.0009 level could pave the way for further price increases, potentially driving the market toward the $0.001 mark or even breaking above it.

Buy TAMA/USD!

Buy TAMA today!

Fartcoin (FARTCOIN/USD) Establishes New Higher Lows: A Bullish Momentum Building

The Fartcoin (FARTCOIN) market is a lighthearted cryptocurrency designed to make crypto more accessible through humor and community engagement. Built on a robust blockchain, it emphasizes transparency, low transaction fees, and a deflationary model to incentivize long-term holding.

Recent price activity has shown a notable surge, driven by increased trading interest. However, the market now appears to be entering a potential consolidation phase around the $1.20 level. The $1.15 level is emerging as a strong support zone, which could serve as a foundation for continued upward momentum.

With its distinctive branding and a dedicated community, FARTCOIN is well-positioned for potential growth in the decentralized finance (DeFi) sector, making it a unique player in the cryptocurrency landscape.

FARTCOIN Market Data

  • FARTCOIN/USD Price Now: $1.20
  • FARTCOIN/USD Market Cap: $1.2 billion
  • FARTCOIN/USD Circulating Supply: 999 million FARTCOIN
  • FARTCOIN/USD Total Supply: 1 billion FARTCOIN
  • FARTCOIN/USD CoinMarketCap Ranking: #92

FartCoin (FARTCOIN/USD) Establishes New Higher Lows: A Bullish Momentum Building

Key Levels

  • Resistance: $1.50, $1.60, and $1.70
  • Support: $1.20, $1.00, and $0.800.

The FARTCOIN Market Through the Lens of Indicators

The daily chart began tracking the FARTCOIN market in October of last year, with initial market activity starting around $0.0238. Since then, the crypto signal has gradually gained upward momentum, particularly toward the end of the year. Increased demand has driven higher volatility, which, while favoring the bulls, has also enabled the bears to strengthen, leading to notable price corrections.

Despite these corrections, the bulls have consistently demonstrated their strength by securing higher support levels after each pullback. This upward progression underscores a strong and characteristic bullish trend. Currently, the bulls appear to be establishing a higher support level at $1.15.

From a bearish perspective, the presence of consecutive bearish candlesticks might indicate a brewing bearish trend. However, the diminishing size of these candlesticks suggests weakening bearish momentum, making a breakdown below $1.15 less likely.

That said, the market’s inherent volatility leaves room for a potential breakdown. If the $1.15 support is breached, the $1.00 level could act as a robust fallback support, providing the bulls with an opportunity to reignite upward momentum and resume the bullish trend.

FartCoin (FARTCOIN/USD) Establishes New Higher Lows: A Bullish Momentum Building

FARTCOIN/USD Price Prediction: 4-Hour Chart Analysis

Focusing on the 4-hour chart, the market shows signs of slowing as the price approaches the $1.15 level. In recent trading sessions, bulls have consistently rejected bearish attempts to push the price below this critical support.

Despite this resilience, current indicators suggest a bearish bias. The RSI line has dipped below the 50 level, and the price action remains beneath the 20-day moving average, reinforcing bearish sentiment. However, the persistent defense by bulls at the $1.15 level could fortify this zone as strong support.

As bearish pressure gradually weakens, the sustained bullish resistance at this level may set the stage for a potential price surge, signaling a shift in market momentum back in favor of the bulls.

Trade crypto coins on BYBIT!

XRP (XRP/USDT) Eyes Further Potential Price Recovery

XRP Long-term Analysis: Bullish

The market analysis for XRP against the Tether showcases a notable recovery trajectory. This is characterized by a consistent uptrend after a prolonged consolidation phase.

Over recent weeks, XRP’s price has surged, breaking significant resistance levels and forming a bullish structure. However, recent price movement above the Guppy Multiple Moving Averages (GMMAs) shows that the pair is poised for further price recovery towards the psychological $3.000 level. To this end, XRP/USDT may continue its bullish stride provided market participants increase.

Currently, XRP trades at $2.4307 with a moderate 300.3 million traded volume.

XRP (XRP/USDT) Eyes Further Potential Price Recovery
XRPUSDT-Weekly Chart

Technical Indicators

Major Resistance Levels: $2.4690, $2.5860, and $3.000

Major Support Levels: 2.0866, $1.8517, and 1.2750

XRP Technical Analysis

The analysis of XRP against the Tether shows that the pair is currently in a recovery phase. This is supported by a strong signal from the GMMAs, as seen in the price positioning with the upward divergence of the sets of EMAs. Though this confirmed a strong uptrend, maintaining the $2.0866 support level is crucial to attaining $3.000.

On the other hand, the Stochastic RSI suggests an impending upside movement in the near term as the lines prepare for a bullish crossover. To this end, the pair may experience a minor dip if the line drops below the 50-mark level. However, traders should watch out for price actions around $2.4690 for a confirmed uptrend; otherwise, a drop below $2.0866 would signal a weak buying interest.

XRP/USDT Analysis: Where from Here?

On the daily timeframe, XRP/USDT seems to be consolidating, suggesting a pause in the bullish action. The positioning and upward divergence of the GMMAs indicate sustained bullish pressure.

However, the Stochastic oscillator at the bottom of the chart signals a potential sign of a recovery as the lines draw nearer to a bullish crossover.

To this end, the market needs more bullish participants, as increased volume could cause the XRP price to break above $2.4690 and possibly reach $2.5860 soon. Conversely, the oscillator’s overbought condition will likely make $2.3267 a re-entry point for a major upside move.

XRP (XRP/USDT) Eyes Further Potential Price Recovery
XRPUSDT-Daily Chart


You can purchase crypto coins here. Buy Block

Hedera (HBAR/USD) Breaks $0.30 Resistance: Eyes Set on $0.35 Target

After a rapid bullish surge that propelled the price near the $0.40 level and triggered significant profit-taking, the $0.30 level has emerged as a key re-entry point for optimistic Hedera traders. However, as bullish momentum reappeared at this level, bearish pressure also intensified, leading to a struggle between the two forces.

At one point, the bearish sentiment gained a slight upper hand, causing the price to dip to approximately $0.25. Nevertheless, the bulls swiftly regained control, rallying the market back to the $0.30 mark. While the ongoing tug-of-war between demand and supply persists, the bulls have successfully established a foothold above $0.30. If this momentum continues, the market could see further upward movement in the near future.

Hedera Market Data

  • HBAR/USD Price Now: $0.33
  • HBAR/USD Market Cap: $12 billion
  • HBAR/USD Circulating Supply: 38.25 HBAR
  • HBAR/USD Total Supply: 50 billion HBAR
  • HBAR/USD CoinMarketCap Ranking: #17

Hedera (HBAR/USD) Breaks $0.30 Resistance: Eyes Set on $0.35 Target

Key Levels

  • Resistance: $0.35, $0.40, and $0.45
  • Support: $0.30, $0.25, and $0.20.

Hedera Through the Lens of Indicators

The market eventually settled into a narrow horizontal channel as the volatility triggered by traders’ rush on both sides of the market subsided, leading to a consolidation phase. Bulls regrouped at the $0.25 level, which caused the price to rally into the new year. The market surged and is now sustaining levels above $0.30. However, bearish pressure is noticeable at the $0.33 price level, as reflected by the upper shadow on the current candlestick representing today’s trading activity. This indicates that once the Hedera price reaches the $0.33 level, bearish sentiment tends to push the market lower. If the bearish momentum drives the price down to the $0.30 level, a potential bounce could occur, with the market breaking the resistance at $0.33.

Hedera (HBAR/USD) Breaks $0.30 Resistance: Eyes Set on $0.35 Target

HBAR/USD Price Prediction: 4-Hour Chart Analysis

A key indicator to monitor in assessing the market’s performance is the declining histograms of the trading volume indicator. This trend suggests that the market may be preparing to consolidate around the $0.30 level, particularly above it. A consolidation above this critical $0.30 price point could be favorable for the bulls, as it would establish a strong support level. This support would provide the bullish side of the market with the necessary foundation to break the $0.33 resistance and establish a new higher low.

Trade crypto coins on BYBIT!

Decentraland (MANA/USD) is Positioned for Bullish Trend Resumption

Price Analysis: MANA/USD Transition from the Bearish Pullback to a Potential Renewed Bullish Momentum

Following a significant peak in early December 2024, MANA/USD transitioned into a bearish phase after an extended period of bullish momentum. This downward trend was reinforced by signals from the daily Moving Average, which aligned with the bearish market structure. However, as the price approached the critical support level at $0.4540, the market exhibited a structural shift, signaling a potential reversal.

MANAUSD Key Levels

Demand Levels: $0.5680, $0.4540
Supply Levels: $0.6890, $0.8630

Decentraland (MANA/USD) is Positioned for Bullish Trend Resumption

This bullish reversal was confirmed as the daily Moving Average shifted to indicate upward momentum, with the price breaking above this indicator. Consequently, MANA/USD recovered to the $0.5680 level, showcasing renewed bullish intent and signaling further upward potential.

On the 4-hour chart, a bullish break of structure (BOS) was observed as the price decisively climbed above the $0.5680 resistance level. This move suggested the market’s transition to bullish dominance. However, the 4-hour Relative Strength Index (RSI) highlighted overbought conditions, indicating waning price momentum and the possibility of a short-term corrective pullback.

Decentraland (MANA/USD) is Positioned for Bullish Trend Resumption

Market Expectation

The bearish pullback is expected to find support at a well-defined 4-hour order block, a key area of institutional interest. From this level, the price is likely to regain bullish momentum, targeting the $0.6890 level as its next major resistance. A successful breach of this level could signal the continuation of the broader bullish trend.

You can purchase Lucky Block here.  Buy LBLOCK

Note: Cryptosignals.org is not a financial advisor. Do your research before investing your funds in any financial asset or presented product or event. We are not responsible for your investing results

Litecoin Price Prediction: LTC/USDT Retraces Southwards

Litecoin Price Prediction (January 7):

The Litecoin market has resumed trading above the $110 price level. However, since the previous session, the market has been retracing downwards. Nevertheless, price action remains above important technical marks.

LTC/USDT Long-Term Trend: Bullish (Daily Chart)

Key Price Levels:

Resistance: $115.00, $120.00, $125.00

Support: $105.00, $100.00, $95.00

Litecoin Price Prediction: LTC/USDT Retraces Southwards

The last two price candles on the chart are bearish. Nevertheless, the price remains above the opening price of the past two trading sessions. In addition, the Moving Average (MA) has delivered a death cross below the recent price action. This coincides with the downward crossover of the Stochastic Relative Strength Index (RSI) lines in the overbought region. The Stochastic RSI indicator lines now have a slight downward bias following the crossover in the overbought region of the indicator.

Litecoin Price Prediction: LTC/USDT Appears Up Against Strong Headwind

Looking at the price movement pattern in Litecoin’s daily chart, it can be seen that price action hinted at a bullish breakout earlier. This resulted in price action breaking out of the technical resistance at the $110 price mark. However, afterward, the market encountered headwinds around the $115 price level.

The upside effect of the delivered death cross below price action seems to have been exhausted. Likewise, the bearish crossover on the Stochastic RSI indicates that downward forces are likely to drive the market in the meantime. However, with price action still above the $110 baseline and above all the MA lines, traders can still anticipate an upward rebound off those marks.

Litecoin Price Prediction: LTC/USDT Lands on a Critical Support (4-Hour Chart)

In the Litecoin 4-hour chart, price action has been moving very slowly at intervals. Here, since the past two sessions, price action has been bearish until the current session. The last price candle on the chart now sits just above the 200-day MA line while already placing the price of the token below the 20-day MA line. Meanwhile, the Stochastic RSI lines have moved very deep into the oversold region. The lead line is already touching the 0 level of the indicator.

Litecoin Price Prediction: LTC/USDT Retraces Southwards

From indications arising from the LTC 4-hour market, it can be seen that price action has the potential to rebound soon. The movement of the Stochastic RSI lines has been overly hyperactive, falling too deeply into the oversold region of the indicator, given the magnitude of price movement. Meanwhile, price action can be seen standing just above the 200-day MA curve. Therefore, traders can anticipate an upward rebound off the 200-day MA or the $110 support level, towards the $120 threshold.

Get Litecoin here. Buy LTC

$SPONGE (SPONGE/USD) Soars from $0.00003 to Beyond $0.000045 in a Remarkable Rally

The $SPONGE (SPONGE/USD) market has experienced a significant surge, breaking free from its consolidation around the $0.00003 price level and climbing past the critical $0.00004 threshold. The bullish momentum pushed prices to a peak of $0.00005 before profit-taking by traders led to a slight pullback, with the price currently hovering around $0.000047. A potential rebound is anticipated if the market corrects further to $0.000045. If this bounce fails to occur, the market is expected to maintain stability above the $0.00004 level.

Key Market Dynamics:

  • Resistance Levels: $0.00005, $0.000055, $0.000060
  • Support Levels: $0.000020, $0.0000195, $0.000019

$SPONGE (SPONGE/USD) Soars from $0.00003 to Beyond $0.000045 in a Remarkable Rally

SPONGE/USD Technical Analysis

Maintaining support above $0.00004 could be an early indicator of continued bullish strength. The recent price rally has widened the Bollinger Bands, reflecting heightened volatility. This surge in SPONGE/USD market activity could encourage bearish resistance near critical levels between $0.000045 and $0.00005.

The $0.000040 to $0.000045 range now functions as a higher support zone, while the $0.00003 level remains a solid foundational support. Notably, the 4-hour chart reveals a strong bullish candlestick, a pattern often associated with continued upward momentum. This suggests that bulls may establish a higher support level if corrective pressures persist.

$SPONGE (SPONGE/USD) Soars from $0.00003 to Beyond $0.000045 in a Remarkable Rally

$SPONGE (SPONGE/USD) 1-Hour Chart Observations

The 1-hour chart highlights a sharp bullish breakout, supported by strong trade volume, as evidenced by the histogram. This signals robust buying interest and reinforces the current bullish trend. However, the Relative Strength Index (RSI) reading of 84 indicates that the market is in overbought territory, suggesting the potential for a sharp correction.

In the event of a pullback, traders may seek to reenter bullish positions around the $0.00004 mark, which now serves as a higher support level compared to the previous $0.00003 zone.

Buy $SPONGE!

Join the SPONGE community and be part of the next big crypto sensation! Buy Sponge ($SPONGE) today!

$SPONGE (SPONGE/USD) Rockets from $0.00003 to Over $0.000045 in a Stellar Price Surge

The $SPONGE (SPONGE/USD) market has surged impressively, breaking away from its equilibrium price at $0.00003 and surpassing the critical $0.00004 level. The price peaked at $0.00005 before traders began taking profits, leading to a pullback to the current level of $0.000047. A potential bounce is anticipated if the corrective phase reaches $0.000045. However, if this bounce does not materialize, the market is likely to stabilize above the $0.00004 level.

 Key Market Dynamics:

  • Resistance Levels: $0.00005, $0.000055, $0.000060
  • Support Levels: $0.000020, $0.0000195, $0.000019

$SPONGE (SPONGE/USD) Rockets from $0.00003 to Over $0.000045 in a Stellar Price Surge

$SPONGE (SPONGE/USD) Technical Outlook

If the $SPONGE market sustains above the $0.00004 level, it would signal an early indication of bullish momentum. The recent price breakout has caused the Bollinger Bands to expand significantly, highlighting increased market volatility. This heightened volatility could empower bearish activity near critical resistance zones, such as the $0.00005 to $0.000045 range.

While the $0.000040 to $0.000045 zone serves as a potential higher support area, the $0.00003 level has been reinforced as a strong foundational support. However, given the robust bullish candlestick observed in the ongoing 4-hour trading session, there is a strong likelihood that bulls may establish a higher support level if the corrective phase continues.

$SPONGE (SPONGE/USD) Rockets from $0.00003 to Over $0.000045 in a Stellar Price Surge

$SPONGE (SPONGE/USD) 1-Hour Chart Insights

Analyzing the market from the 1-hour chart, we observe a strong and sudden bullish breakout, supported by the trade volume histogram. This adds credibility to the ongoing bullish momentum, indicating strong buying interest among traders. However, the Relative Strength Index (RSI) suggests the market is highly overbought, with the RSI reading at 84, signaling elevated volatility and the potential for a significant correction.

Should a correction occur, traders may look to reenter bullish positions around the $0.00004 level, which now serves as a higher support compared to the previous $0.00003 support zone.

Buy SPONGE/USD!

Join the SPONGE community and be part of the next big crypto sensation! Buy Sponge ($SPONGE) today!

Jeju Island’s Plan to Attract Gen Z Tourists with Crypto Cards

Jeju Island, a prominent tourist attraction in South Korea, plans to implement an innovative crypto solution to draw younger travelers. By launching Non-fungible token (NFT) tourist cards in 2025, the island aims to combine cutting-edge blockchain technology with tourism perks, catering specifically to Millennials and Generation Z.

As part of the plan, the island will subject these digital tourism cards to trial before a full rollout in the second half of the year.

Leveraging Technology to Enhance Tourism  

Jeju Island’s introduction of NFT tourist cards represents a strategic shift to digital solutions to revitalize its tourism sector. These cards will offer incentives such as travel subsidies and discounts on tourist attractions, to boost the appeal for tech-savvy younger generations.

Jeju Island’s Plan to Attract Gen Z Tourists with Crypto Cards
Korean volcanics: the magic of Jeju island | VolcanoCafe. Source: Wikipedia

However, this is not Jeju’s first blockchain initiative; in 2021, the island launched a blockchain-based COVID-19 contact tracing app, showcasing its openness to adopting emerging technologies.

Additionally, discussions held in March 2024 explored NFT applications beyond tourism, such as museums, restaurants, and the fishing industry. These steps emphasize Jeju’s commitment to integrating blockchain into its economy.

South Korea’s Expanding Crypto Ecosystem  

At present, the initiative aligns with South Korea’s growing adoption of blockchain and crypto technologies. As of November 2024, the number of crypto users in the country had surged to 15.6 million; this represents about 30% of the population and an increase of 610,000 users within a month.

In addition, NFT sales volumes reached $8.83 billion in 2024, surpassing 2023’s figures by $100 million, though still falling short of the $23.7 billion peak in 2022. These figures underscore the rising popularity of digital assets among South Koreans, particularly younger folks.

To this end, Jeju Island’s NFT tourist card initiative blends blockchain innovation with tourism incentives to attract Millennials and Gen Z. By capitalizing on South Korea’s increasing crypto adoption, Jeju aims to position itself as a forward-thinking, tech-driven tourist hotspot.


In order to place winning trades with us via Bybit, you can open an account here.