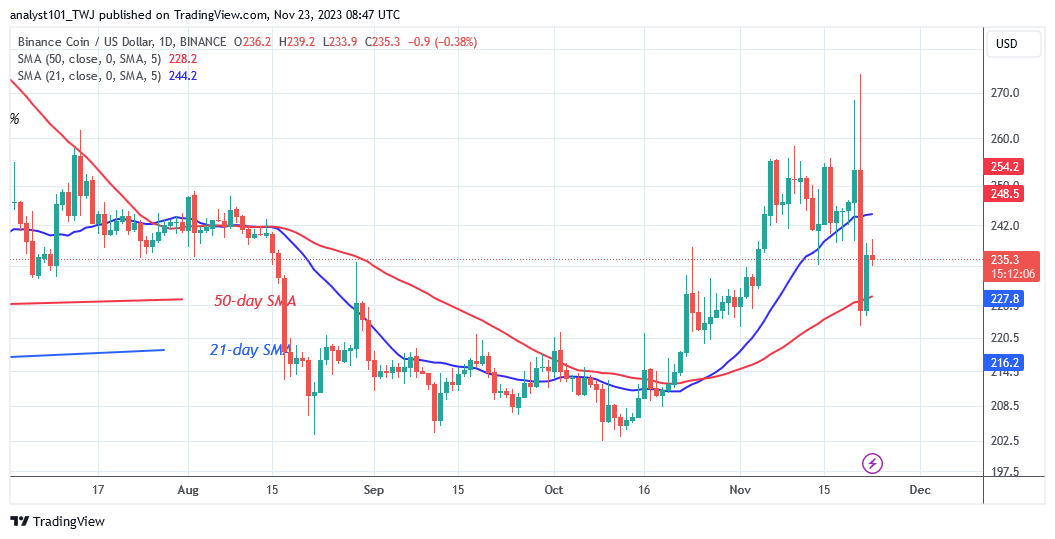
BNB (BNB) Long-Term Analysis: Bullish The price of BNB (BNB) is falling below the moving average lines as it maintains its range-bound move. The crypto was trading sideways beneath the resistance level at $260 before the most recent decline. The cryptocurrency is correcting upward, but it is caught between the moving average lines. The upward correction has come to a halt just below the resistance level of $240.
In that event, BNB/USD may continue its downward trend. The altcoin is currently dropping towards the 50-day moving average ($MA). If the altcoin falls below the 50-day SMA, it will revert to the prior range bound zone of $203 to $220. On the upside, future price increases are met with resistance at the $240 and $260 price levels.
BNB/USD – Daily Chart
Technical indicators: Major Resistance Levels – $440, $460, $480 Major Support Levels – $240, $220, $200
BNB (BNB) Indicator Analysis The price bars have been caught between the moving average lines for the past two days. The price bars had broken through the moving average lines before they were trapped. Since November 6, when the uptrend ended, the lines representing the moving averages have remained horizontally flat.
What Is the Next Direction for BNB (BNB)? Binance Coin falls after the upswing reaches an end as it maintains its range-bound move. The altcoin recovered above the important support level of $220. If the current support holds, the upward trend will resume. On the downside, if BNB loses its present support near $220, it will revert to its former range.
Note: Cryptosignals.org is not a financial advisor. Do your research before investing your funds in any financial asset or presented product or event. We are not responsible for your investing results
Investors in the TAMA/USD market have demonstrated resilience amid a bearish market initiated from the pinnacle of the $0.010 price level, effectively tempering downward momentum. At present, the market finds itself at a pivotal crossroads, notably the $0.0078 price level—marking the inception point of the preceding bullish surge. Drawing insights from historical trends, there is discernible potential for a market resurgence originating from this crucial level.
Key Levels:
Resistance: $0.013, $0.014, and $0.015.
Support: $0.0075, $0.0073, and $0.007.
TAMA/USD Price Analysis: Interpreting the Indicators
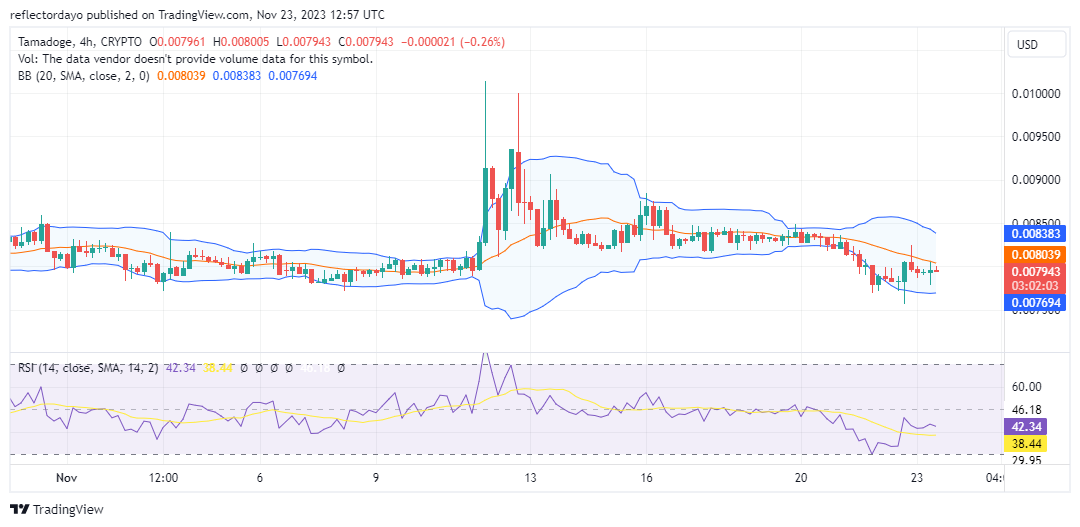
However, a meticulous examination of the TAMA/USD market, employing indicators and the daily chart, reveals a point of concern as the market grapples with a deadlock beneath the 20-day moving average. The ongoing consolidation beneath this moving average signifies a palpable presence of bearish sentiment, even within the traditionally bullish domain. The prevailing standoff between bulls and bears at this juncture hints at the potential for a swift recovery by the bullish faction.
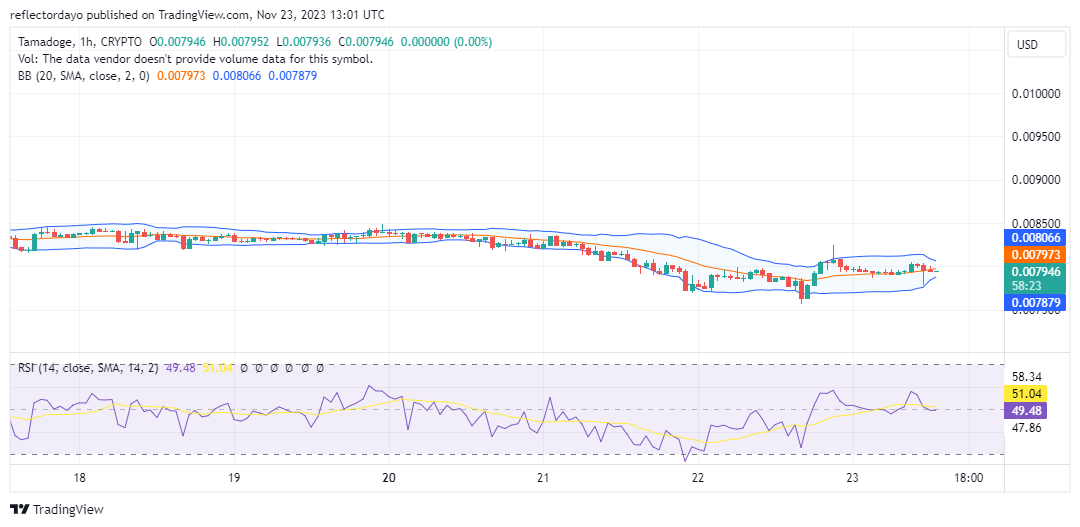
A nuanced scrutiny of the market through the lens of the 1-hour chart portrays a landscape of equilibrium. The price action demonstrates horizontal movement, aligning with the Relative Strength Index (RSI) line, which positions itself at the midpoint of the indicator. This configuration suggests a potential protracted consolidation phase along the support level before an eventual price rally. Investors are well-advised to vigilantly monitor market dynamics, with particular attention to subtle breakouts above immediate resistance levels, which serve as potential confirmation for the commencement of an upward trajectory.
There are some NFT winners already, and you too stand a chance of winning some cool Tamadoge NFTs.
Congratulations to our NFT Contest winners 🎉
⭐️️Lars Rosenau – Ultra Rare
⭐️ Travis John Owens – Rare
⭐️ Rahul Roy – Rare
⭐️ Ranajoy Roychowdhury – Common
⭐️️Isabel Descos – Common
NFTs have been sent and you can now use them as your characters in all Tamadoge games! pic.twitter.com/gbrXAFBCbN
Tamadoge buyers have maintained their positions in the face of a bear market that commenced at the peak of the $0.010 price level, thereby mitigating the bearish momentum. Currently, the market stands at a critical juncture, specifically the $0.0078 price level, which served as the starting point for the preceding bullish run. Drawing insights from historical performance, there is a likelihood of a market rally emanating from this $0.0078 price level.
Key Levels
Resistance: $0.013, $0.014, and $0.015.
Support: $0.0075, $0.0073, and $0.007.
TAMAUSD Price Analysis: The Indicators’ Point of View
However, upon examining the Tamadoge market through the lens of indicators and the daily chart, we observe a reason for concern as the market has reached an impasse below the 20-day moving average. The current consolidation beneath the 20-day moving average indicates a notable presence of bearish sentiment, even within the domain traditionally favorable to bulls. The ongoing standoff between bulls and bears at this price level suggests the potential for a swift recovery by bulls.
Tamadoge Short-Term Outlook: 1-Hour Chart
Analyzing the market through the lens of the 1-hour chart, we observe a state of equilibrium. The price action is exhibiting horizontal movement, mirroring the Relative Strength Index (RSI) line, which aligns with the midpoint of the indicator. This suggests a potential extended period of consolidation along the support level before a price rally. Investors are advised to closely monitor the market dynamics, specifically watching for a subtle breakout above the immediate resistance level to confirm the potential onset of a price rally.
You can now utilize NFTs as your characters in all Tamadoge games since they have been sent!
Congratulations to our NFT Contest winners 🎉
⭐️️Lars Rosenau – Ultra Rare
⭐️ Travis John Owens – Rare
⭐️ Rahul Roy – Rare
⭐️ Ranajoy Roychowdhury – Common
⭐️️Isabel Descos – Common
NFTs have been sent and you can now use them as your characters in all Tamadoge games! pic.twitter.com/gbrXAFBCbN
As we reported yesterday, Changpeng Zhao, the visionary founder of Binance—the world’s leading cryptocurrency exchange—has confessed to breaching anti-money laundering (AML) regulations in the United States. Zhao pleaded guilty to causing Binance to operate without a robust AML program, potentially leading to a five-year prison term and a $250,000 fine.
The verdict, revealed in a recent court filing, exposes the ongoing crackdown on Binance by U.S. authorities. Accusations include the facilitation of money laundering, tax evasion, and sanctions violations through lax compliance policies—an assertion vehemently denied by Binance, asserting cooperation with investigations.
Prosecutors Say Binance Founder, CZ, Is a Flight Risk
CZ Leaving Court | Source: Bloomberg
Zhao’s sentencing is scheduled for February 23, 2024, but a new twist emerges as he seeks permission to return to his home in the United Arab Emirates (UAE) before the hearing. Proposing an appearance bond of a staggering $175 million, secured by $15 million in cash and three guarantors, Zhao aims to navigate potential extradition issues.
However, U.S. prosecutors are skeptical, challenging the initial decision to allow Zhao to travel to the UAE. They argue that his immense wealth, citizenship, and ties to the UAE pose a substantial flight risk. Complicating matters, the absence of an extradition treaty with the UAE heightens concerns about Zhao evading justice.
Source: Courtlistener
Prosecutors are urging the court to require Zhao’s presence in the U.S. until his sentencing, asserting that he has not provided clear and convincing evidence dispelling the risk of flight.
As the cryptocurrency world watches this legal drama unfold, the case underscores the broader regulatory scrutiny faced by Binance. The exchange, a global giant, confronts allegations of malpractice, putting its future in the balance as investigators delve into accusations of financial impropriety. The outcome could reshape the landscape of the cryptocurrency industry, marking a pivotal moment in its journey toward mainstream acceptance and regulatory compliance.
Want to learn about the best crypto staking platforms? Click here
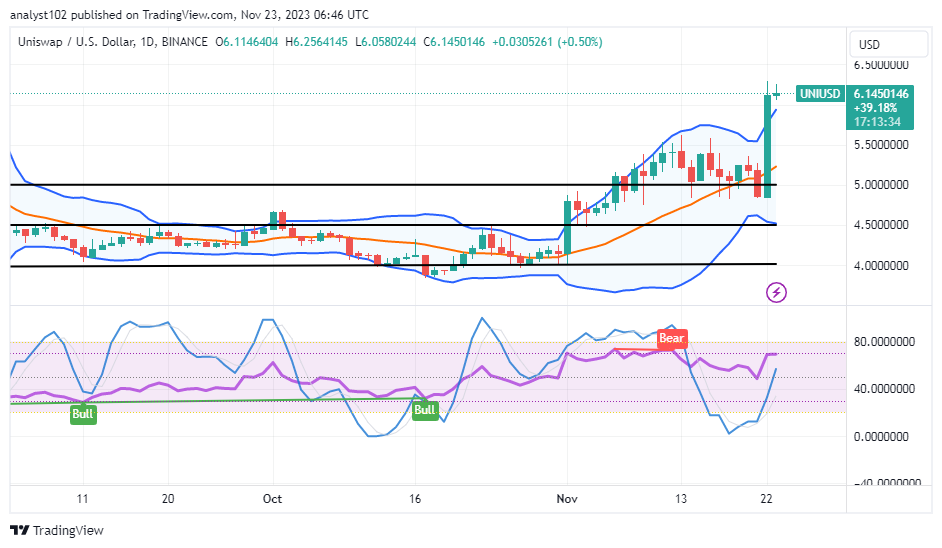
Uniswap Price Prediction – November 23 There have been significant aggressive uprising forces in the UNI/USD market operations, given the cryptocurrency business surges higher after a rebuilding base process around the point of $5, averaging the resistance line of $6.50.
Due to their ability to overcome the logical point of $5.50 to the upside during the most recent session, purchasers are expected to have market control, according to the situational financial record. As things stand, it would be premature to predict that bears will make strong entrances around the $6.50 resistance level. On the other hand, investors are likely to perform steadily during periods of huge uprisings.
UNI/USD – Daily Chart The UNI/USD daily chart showcases that the crypto-economic market surges higher from around the point of $5, averaging the resistance line of $6.50.
It is likely for the northward pressure to reach the psychological resistance line in the near future. The Bollinger Band trend lines are in a northward-pointing mode. A bullish candlestick that emerged has produced a positive wall. The stochastic oscillators have crossed northward, allowing the blue line to push closely toward the other line to indicate that rising gravity is relatively ongoing. How is the trade environment right now in terms of obtaining more consistent ups in the UNI/USD market along the upper Bollinger Band trend line? As there has been an occurrence of a bullish candlestick in the UNI/USD market, spanning from the middle of the Bollinger Band trend line, capitalists should be rest assured that their investment purse is going back to a way of recoveries, having surged higher, averaging the resistance of $6.50.
Notably, the condition that tends to create and rebuild the base on a gradual moving process has been the only one to affect the valuation of the crypto economy. Pushers of long holdings are advised to cooperate with investors by attempting to reverse their positions before making strong advances to the north and without overly leveraging them beyond what the market may need to build upon.
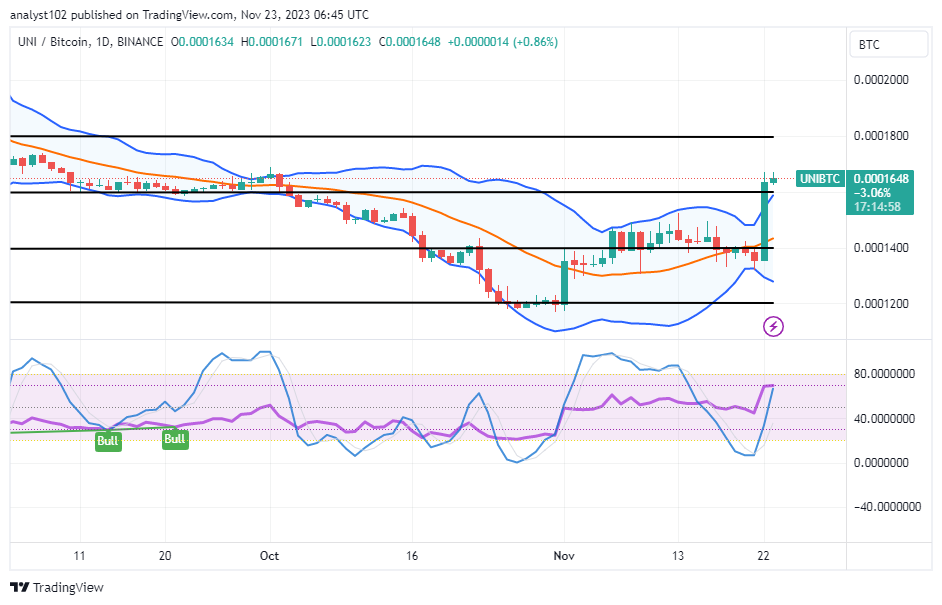
In the interim, selling activity is anticipated to occur only in the event that a bearish candlestick at a higher resistance line confirms the trend. In order to pursue such a situation, sellers would need to deliberately position their presence around the aforementioned restrictions. Should those indicated resistance values not be met, they will have to wait for somewhat higher UNI/BTC Price Analysis In contrast, Uniswap surges higher against the market worth of Bitcoin, averaging a resistance that is not too far above the upper Bollinger Band trend line.
Not too far below the 80-point, the stochastic oscillators are moving in a northerly direction around the value. This suggests that the current smaller bullish candlestick has every chance of producing a longer path through overhead barriers. The trend lines of the Bollinger Band are progressively extending back towards the north from the upper side, indicating that the cryptocurrency on the lower side is beginning to face resistance from its counter-trading tool.
Note: Cryptosignals.org is not a financial advisor. Do your research before investing your funds in any financial asset or presented product or event. We are not responsible for your investing results.
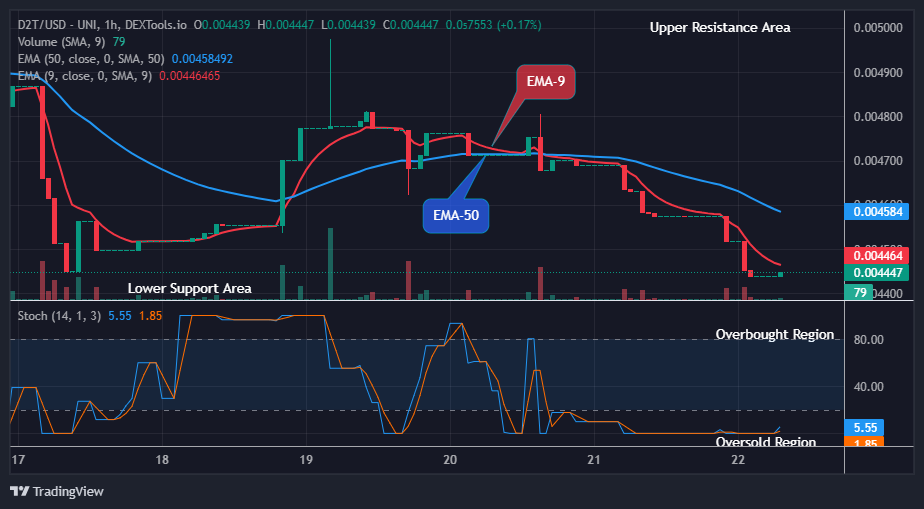
Dash 2 Trade Price Forecast: D2TUSD Next Uptrend Targets $0.01000 Supply Mark (November 23) After completing the downward moves by the bears, the D2TUSD pair has just resumed its bullish rally after hitting the $0.00443 low level to signal a pump. The coin is presently on its way to new resistance trend levels and the next uptrend by the long traders targets the $0.01000 supply mark. The crypto’s price may continue its upside moves to retest the $0.00553 previous high level which could further target the $0.01000 supply amidst the market surge, provided buyers increase their actions in the market. Hence, an intraday gain for the buy traders.
D2T (USD) Long-term Trend: Bearish (4H) D2TUSD is bearish in its long-term outlook. The price responded to the shift in the market structure and is currently trading below the moving averages. The crypto price has been below the supply trend levels since its most recent low due to the persistent bearish pressure over the last few days. However, the current trend will soon be nullified as the market has now resumed its bullish race to the overhead resistance.
The coin is recovering from the recent correction as fresh buying emerges near the supply level following the upward race. The altcoin has completed its correction and is now set for an upswing. The bulls have decided to shift the trend up after a series of lows shortly after today’s 4-hour chart opens.
With the positive sentiment, the Dash 2 Trade price rallied up to the $0.00444 resistance value below the moving averages as a pullback and breached the $0.00443 barrier as the 4-hour chart opens today.
Thus, a possible breakout from the $0.00444 neckline will accelerate the buying momentum and push the prices higher to hit the 0.00553 previous resistance levels. This will bolster more buying pressure on the crypto to the upper resistance levels.
Notably, the market is now pointing up below the 1% range of the daily stochastic. This means that the crypto market is oversold and the emergence of bullish pressure is crucial at this moment.
Hence, the bulls are expected to turn around the price of D2TUSD and the next uptrend target might be the $0.01000 upper supply value amidst a market surge in the days ahead in its higher time frame.
D2T (USD) Medium-term Trend: Bearish (1H) D2TUSD indicates a downward trend with a bearish sentiment in its long-term perspective. The coin is trading below the two EMAs which confirm its bearishness. The sustained bearish pressure at the $0.00443 support value in the previous action has made the crypto price drop below the supply levels in recent times. However, the bulls are now set to further swing up the coin price to its new resistance trend levels.
The current price of Dash 2 Trade at the $0.00444 supply level below the EMAs is a healthy retracement in the crypto price and should bolster buyers for higher recovery. Thus, a possible breakout from the $0.00444 neckline will accelerate the buying momentum and push the prices higher to hit the 0.00497 previous resistance levels.
Additionally, the pair has a target price of $0.01000 upper supply level amidst the market surge as it continues its uptrend movement to the upper resistance as indicated by the daily stochastic pointing upwards. Hence, the mentioned target might be reached in the coming days from a medium-term perspective.
Dash 2 Trade Development Update: Improved event handling, new tables made specifically for auto traders, bug fixes, and further backend caching work.
Dash 2 Trade Development Update: 22.11.2023
Enhanced autotrader functionalities, updated event handling, created specific tables, fixed bugs, and ongoing work on backend caching.
-Improvements to PNL, API adding process, exchange selection for autotrader. -Updates to events:… pic.twitter.com/SAiFPtUlcv
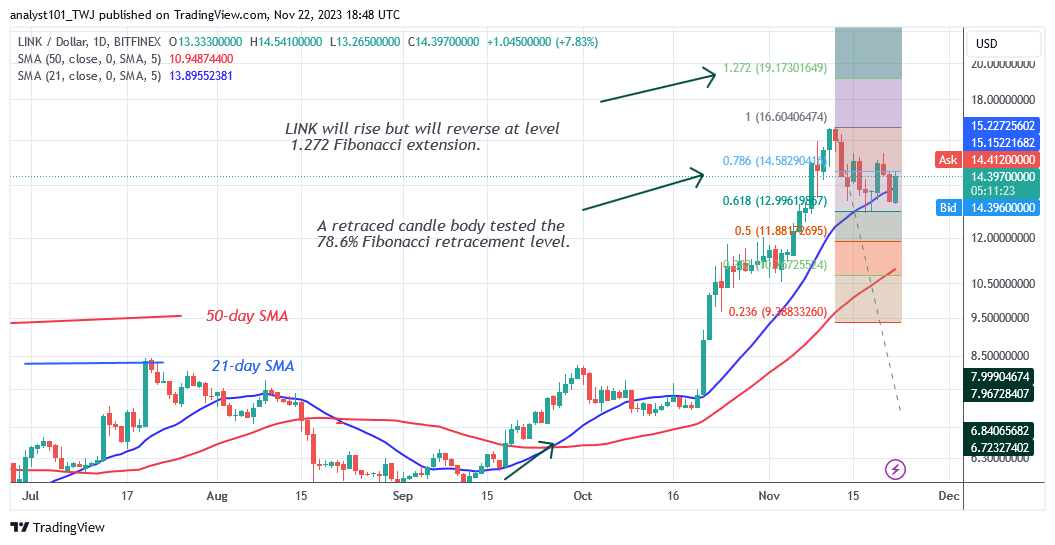
Chainlink (LINK) Long-Term Analysis: Bullish Since November 11, Chainlink’s (LINK) uptrend has been stopped around a high of $16.58 as it trades above $13.40. The altcoin has been trading between $12.80 and $17 during the last week. On November 21, the bears drove the price below the 21-day simple moving average (SMA), but the bulls purchased the dips.
On the plus side, if the current positive momentum is maintained and the market breaks the barrier at $16.58, it will surge to a high of $20. The current rally can terminate if the bears breach below the 21-day SMA. The price of LINK will fall even further to $10.50. Meanwhile, the altcoin is currently trading at $14.39 at the time of writing.
LINK/USD – Daily Chart
Technical indicators: Major Resistance Levels – $8.00, $10.00, $12.00 Major Support Levels – $6.00, $4.00, $2.00
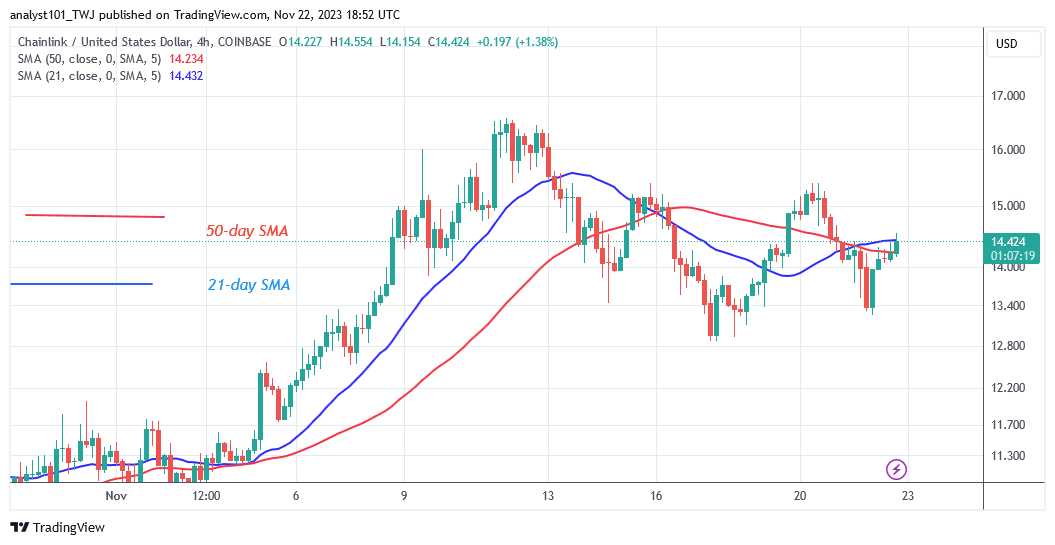
Chainlink (LINK) Indicator Analysis The price bar is currently above the moving average lines, although it was below them on November 21. If the bearish momentum remains below the moving average line, selling pressure will resume. The 4-hour chart’s moving average lines are sloping horizontally due to the current lateral trend. The price bars are rising and falling below the moving average lines.
What Is the Next Direction for Chainlink (LINK)? The cryptocurrency is now moving sideways as it trades above $13.40. Chainlink has yet to overcome the $16.58 resistance level. The coin is currently worth between $12.80 and $17. The market will trend if the current support and resistance levels are breached.
Note:Cryptosignals.org is not a financial advisor. Do your research before investing your funds in any financial asset or presented product or event. We are not responsible for your investing result
Exchange-traded funds, commonly known as ETFs, serve as investment instruments designed to mirror the performance of specific assets or commodities. In the realm of bitcoin, ETFs present a streamlined opportunity for investors to participate in its price dynamics without the necessity of directly holding the cryptocurrency. By acquiring shares of a bitcoin ETF through traditional brokerage accounts, investors can bypass the complexities associated with cryptocurrency exchanges and wallet management. This enhanced accessibility has the potential to foster a connection between traditional financial markets and the world of bitcoin.
The nod from the Securities and Exchange Commission (SEC) has ushered in approval for various bitcoin ETFs, particularly those rooted in futures contracts. Diverging from direct ownership of bitcoin, these ETFs follow futures contracts that anticipate the cryptocurrency’s price at a predetermined future date. The imperative to trade or replace these contracts as they approach expiration is a pivotal aspect. Notwithstanding these strides, the elusive realm of a spot bitcoin ETF, designed to mirror the real-time price of bitcoin, remains unattained. Multiple applications have faced denials, with the SEC emphasizing concerns related to investor protection and public interest.
Distinctions Between Trusts and Spot ETFs
In the realm of bitcoin investment, the nuances between exchange-traded funds (ETFs) and trusts become apparent, stemming from divergent structures and regulatory landscapes. A Bitcoin trust operates as a closed-end fund exclusively dedicated to bitcoin holdings. Contrary to the redeemable nature of ETF shares, as exemplified by entities like the Grayscale Bitcoin Trust, shares in a bitcoin trust cannot be exchanged for the actual cryptocurrency. Consequently, the valuation of trust shares may exhibit variance from the real-time value of bitcoin.
Contrarily, a Spot Bitcoin ETF adopts an open-end fund structure, introducing a flexible share issuance mechanism. Its primary objective is to mirror the real-time price of bitcoin. The uniqueness of ETFs lies in their ability to issue or redeem shares in response to market demand, fostering alignment between the ETF’s price and the authentic value of bitcoin. Furthermore, the regulatory oversight of ETFs falls within the ambit of the Investment Company Act of 1940, providing a sturdy framework for consumer protection.
Hurdles in Spot Bitcoin ETF Greenlights
While the mainstream embrace of bitcoin continues to grow, the SEC exercises prudence in endorsing spot bitcoin ETFs. Historical applications often stumble over the absence of a critical component—a’surveillance-sharing agreement’ with prominent, regulated bitcoin markets. This agreement is deemed essential by the SEC to deter market manipulation, providing a means for comprehensive investigations in cases of suspicious activities.
The recent filing by BlackRock for the iShares Bitcoin Trust injects a sense of optimism into this landscape. Notably, the submission includes provisions for the crucial surveillance-sharing agreements, marking a potentially pivotal shift. BlackRock, boasting an impressive track record of ETF approvals with only one out of 575 applications rejected by the SEC, heightens expectations for a more favorable climate in the approval process.
Implications of a Spot Bitcoin ETF on Market Dynamics The advent of a spot bitcoin ETF holds transformative potential for both the bitcoin landscape and the broader financial markets. A glance at the historical trajectory of gold ETFs, epitomized by the 2004 launch of SPDR Gold Shares, offers instructive insights. Within six years, it amassed over $1 billion in assets, skyrocketing to an astonishing $50 billion by 2010. Although constituting a fraction of the global gold supply, gold ETFs wielded substantial influence over trading dynamics, amplifying market volume and liquidity. Drawing parallels to this historical precedent, a spot bitcoin ETF has the potential to usher in a new era of bitcoin adoption and elevate market liquidity.
Positive Perspectives:
Market Credibility Reinforcement:Official endorsement through an ETF could solidify bitcoin’s position in traditional finance, beckoning both institutional and retail investors.
Augmented Market Stability: Increased participation may contribute to a more stabilized bitcoin market, mitigating sharp price fluctuations.
Regulatory Clarity: The regulatory framework of a bitcoin ETF provides a transparent and secure avenue for potential investors.
Simplified Entry: The ETF model streamlines the investment process, which is particularly advantageous for newcomers hesitant about navigating direct bitcoin purchases.
Potential Concerns:
Regulatory Sensitivity: Closer ties to sanctioned financial products could render bitcoin’s valuation more vulnerable to regulatory decisions.
Manipulation Risks: Significant bitcoin stakeholders might exploit the market to favor their ETF holdings, introducing a potential for price manipulation.
Altered Investment Patterns: Some investors may be dissuaded from directly acquiring bitcoin, opting for the convenience of an ETF.
Operational Costs: Investors considering a bitcoin ETF must weigh the impact of management fees, a consideration less pronounced when acquiring bitcoin directly.
In conclusion, the introduction of a spot bitcoin ETF holds the promise of bridging conventional investment channels, allowing investors to seamlessly incorporate bitcoin into their portfolios and pensions. For an asset increasingly capturing institutional interest, the advent of such an investment vehicle appears inevitable, albeit accompanied by challenges and potential drawbacks.
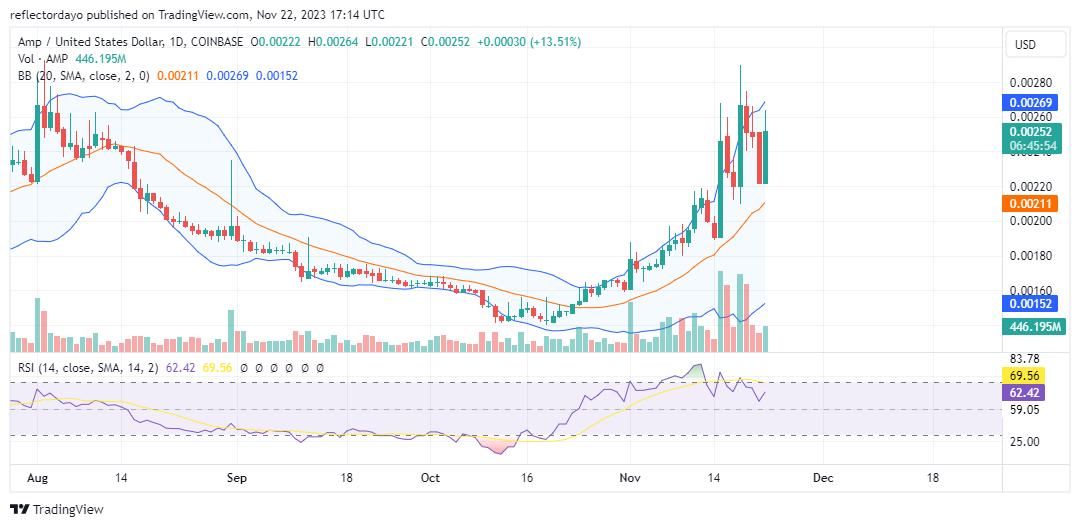
The Amp bull market was initiated in the latter part of October, gaining significant upward momentum in mid-November following the establishment of a support level around $0.0019. This upward volatility propelled the market beyond the $0.0020 price level. Notably, above the $0.0020 price level, a convergence of sell orders has been observed, specifically above the $0.002 threshold. Despite this, the prevailing sentiment in the market remains bullish.
The Amp Market Market Data
AMP/USD Price Now: $0.00252
AMP/USD Market Cap: $105,934,774
AMP/USD Circulating Supply: 42,227,702,186 AMP
AMP/USD Total Supply: 99,213,408,535
AMP/USD CoinMarketCap Ranking: #283
Key Levels
Resistance: $0.0027, $0.0028, and $0.00290.
Support: $0.00210, $0.0020, and $0.00190.
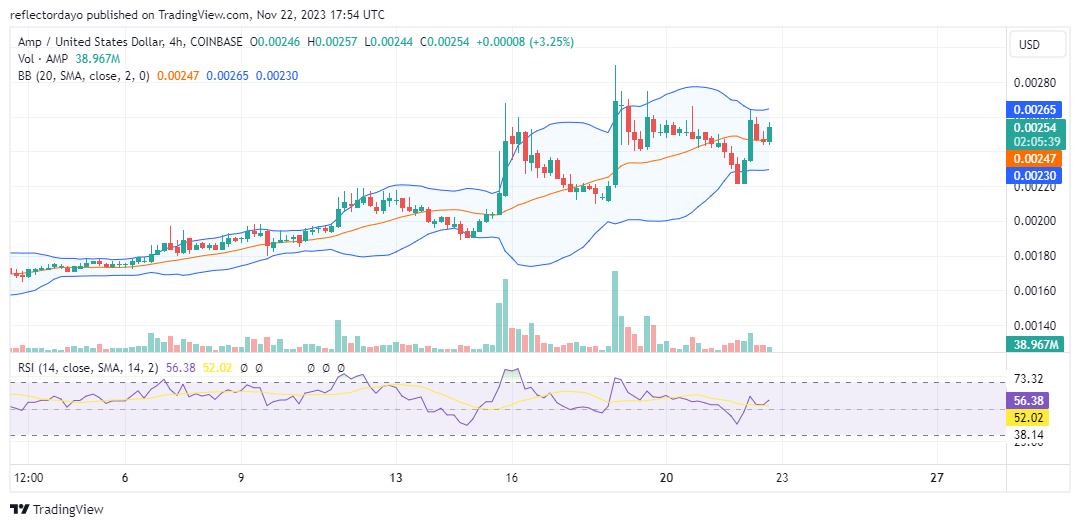
The Amp Market Price Forecast: Analyzing the Indicators
The Bollinger Bands depict an upward-moving price channel, signifying significant volatility as the price trends upwards. Despite the gathering of bearish traders around the $0.00269 price level, the robust bullish signal indicated by the Bollinger Bands suggests that bears face formidable resistance. Both the upper standard deviation curve and lower standard deviation, along with the Simple Moving Average (SMA), are on an upward trajectory, reinforcing the dominance of bulls in the current the Amp market.
AMP/USD 4-Hour Chart Outlook
Upon reaching the $0.0025 price level, a balance between demand and supply emerged, prompting the market to undergo a sideways consolidation. Anticipated in this scenario is an intensification of the ranging price action, leading to a narrowing of the price channel. This is expected to culminate in the establishment of a definitive price level, potentially serving as a support level and ensuring the continuation of the overall uptrend.