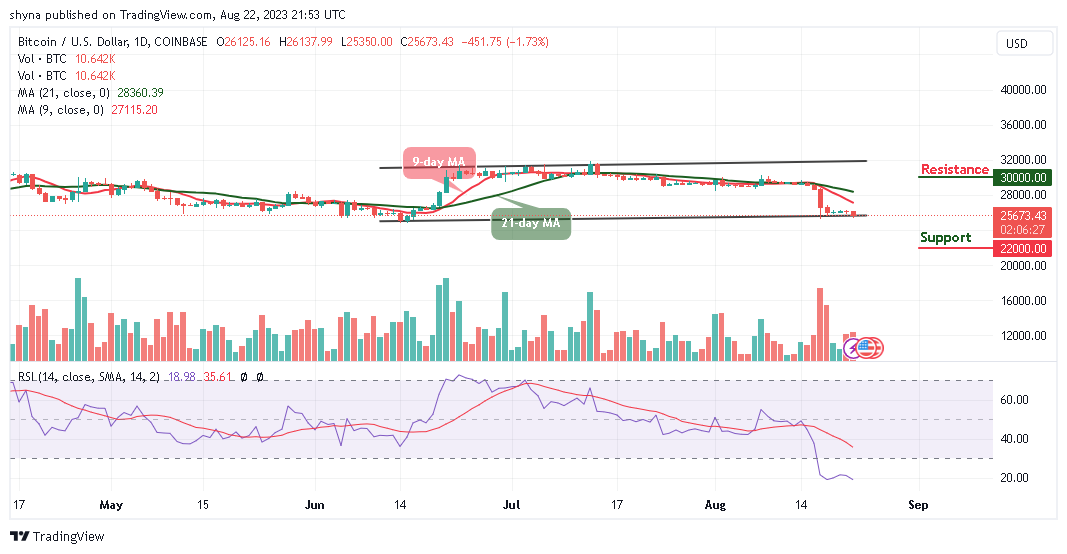
The Bitcoin price prediction shows that BTC is likely to cross below the lower boundary of the channel as the coin touches $25,350 support.
BTC/USD Long-term Trend: Ranging (Daily Chart)
Key levels:
Resistance Levels: $30,000, $32,000 $34,000
Support Levels: $22,000, $20,000, $18,000
BTCUSD – Daily Chart
BTC/USD may continue to face a setback that could drag the coin below the lower boundary of the channel, and the king coin is likely to have an additional bearish run. Currently, Bitcoin (BTC) is trading around the $25,673 level after a free fall from the opening price of $26,126.
Bitcoin Price Prediction: Bitcoin (BTC) Heads to the Downside
The Bitcoin price is currently nose-diving below the moving averages. If the price should slump below the support level of $25,000, it is likely to face a downward trend. Moreover, the further bearish movement could locate the supports at $22,000, $20,000, and $18,000, making room for BTC to fall even further.
In the meantime, the technical indicator Relative Strength Index (14) remains within the oversold region as the trading volume is in support of the bears. On the contrary, if bulls decide to move the price back above the 9-day and 21-day moving averages, BTC/USD may head toward the upper boundary of the channel to locate the resistance levels at $30,000, $32,000, and $34,000.
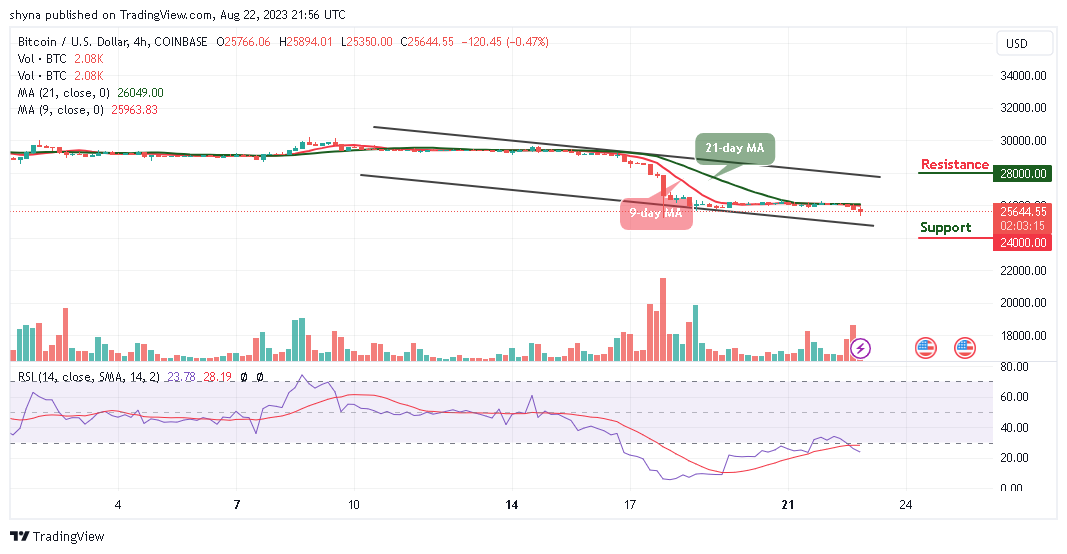
BTC/USD Medium-term Trend: Bearish (4H Chart)
On the 4-hour chart, the Bitcoin price remains below the 9-day and 21-day moving averages and the immediate support is likely to come at the $25,000 level. The price may likely fall below this level if the bears continue to dominate the market.
BTCUSD – 4-Hour Chart
However, a further bearish movement could hit the critical support at the $24,000 level and below, while the resistance is located above the moving averages at the resistance level of $28,000 and above. Meanwhile, the Bitcoin price is currently moving on the negative side as the technical indicator Relative Strength Index (14) stays within the oversold region, suggesting more bearish signals.
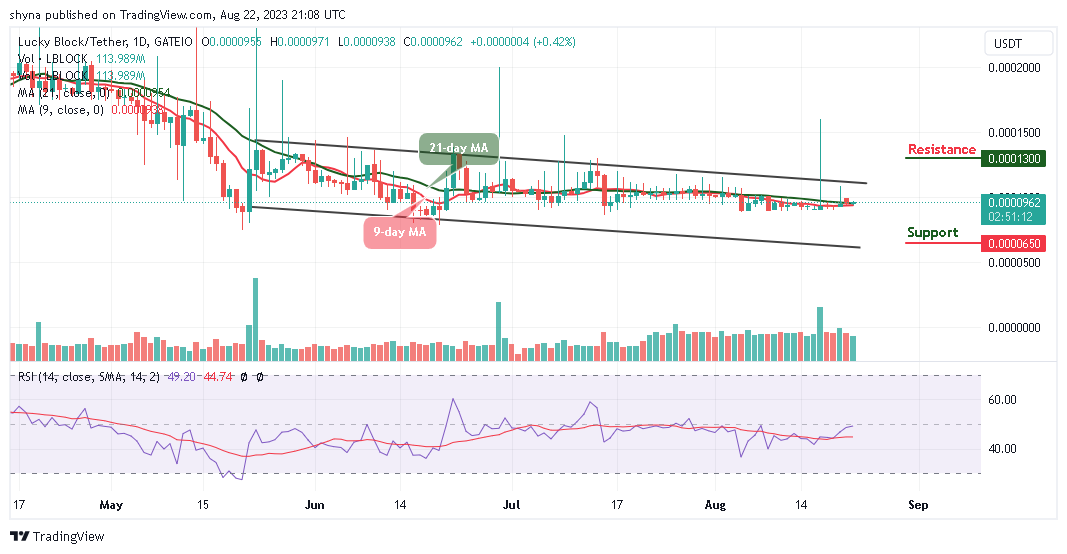
The Lucky Block price prediction reveals that the bulls will begin to increase their entries as the price gets ready for the north.
LBLOCK/USD Medium-term Trend: Ranging (1D Chart)
Key Levels:
Resistance levels: $0.000130, $0.00140, $0.000150
Support levels: $0.000065, $0.000055, $0.000045
LBLOCKUSD – Daily Chart
LBLOCK/USD is beginning to move bullishly as the coin trades above the 9-day and 21-day moving averages. However, the bullish momentum is coming to play in the market, and the bullish pressure could break the $0.000100 level if the increased pressure. Meanwhile, if the bulls fail to drive the price higher, the Lucky Block price may continue to consolidate before gaining additional profit.
Lucky Block Price Prediction: LBLOCK/USD Heads to the Upside
The Lucky Block price is changing hands at $0.000096 where it will head toward the upper boundary of the channel. Moreover, if the coin crosses above the channel, LBLOCK/USD would locate the potential resistance levels at $0.000130, $0.000140, and $0.000150 while the support levels could be found at $0.000065, $0.000055, and $0.000045 respectively. This is because new buyers can come into the market as the technical indicator Relative Strength Index (14) moves to cross above the 50-level.
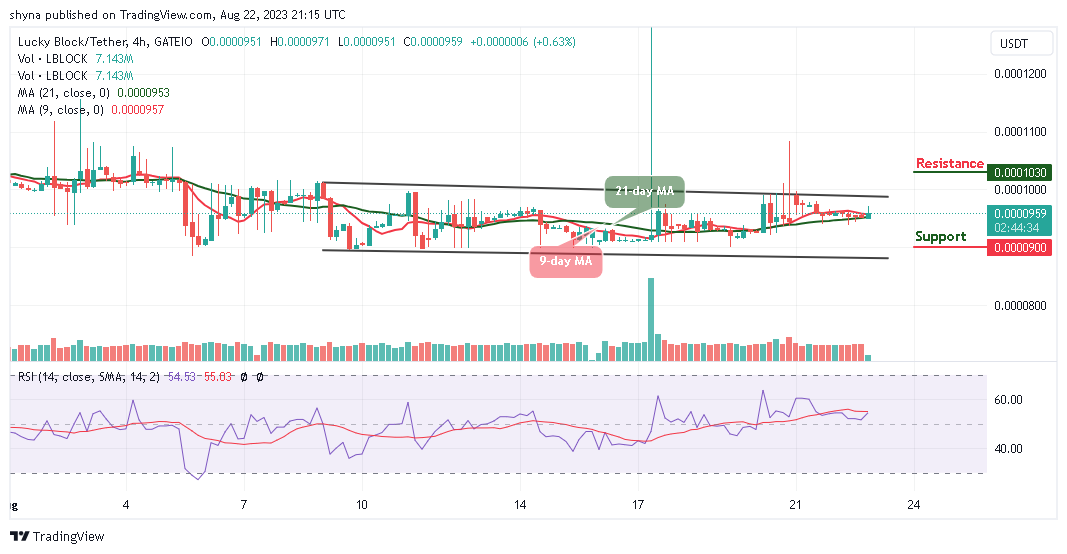
LBLOCK/USD Medium-term Trend: Ranging (4H Chart)
After crossing above the 9-day and 21-day moving averages, the Lucky Block retreats below the daily high of $0.000097 level. Meanwhile, the technical indicator Relative Strength Index (14) will confirm the bullish movement if the signal line crosses above the 60-level. Therefore, any possible cross above the upper boundary of the channel could reach the resistance level at $0.000103 and above.
LBLOCKUSD – 4 Hour Chart
Nevertheless, LBLOCK/USD will begin to display some bullish signals as the bearish movement fades out, but if the price drops and slides and face the lower boundary of the channel, it could touch the nearest support at $0.000090 and below.
Initially, we observed the Tamadoge market exhibiting a ranging behavior. However, over time, the price gradually gravitated towards lower levels. Eventually, the bear market encountered significant bearish support at the $0.00600 price level, which acted as a formidable barrier. This specific price level served as a crucial pivot point for the impending bull market surge, as an intense influx of buying activity emanated from the $0.00600 price mark.
The bear market was initiated above the $0.010 price level, yet the bulls effectively defended the market’s integrity by establishing a robust support level at $0.00800. This higher support level became instrumental in preventing further decline. Given this context, the potential for the bull market to resume at this juncture remains viable.
Key Levels
Resistance: $0.015, $0.016, and $0.017
Support: $0.0080, $0.0070, and $0.0065
TAMAUSD Price Analysis: The Indicators’ Point of View
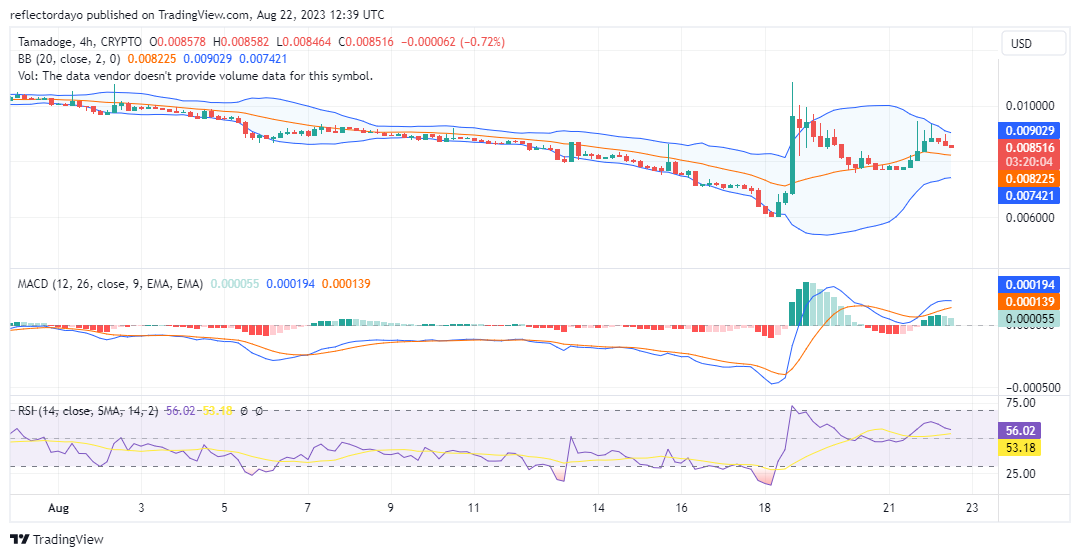
During the prior daily trading session, the Tamadoge bulls endeavored to push the price towards their target; however, sellers adjusted their positions slightly downward. Presently, in reaction to this, buyers are aiming to secure an elevated support level beyond the 20-day moving average. This evolving situation has led to the convergence of the Bollinger Bands.
The convergence of support and resistance entails three potential outcomes. Yet, given that this convergence is transpiring above the 20-day moving average and within the buy zone of the Relative Strength Index, the advantage may lean towards the bulls.
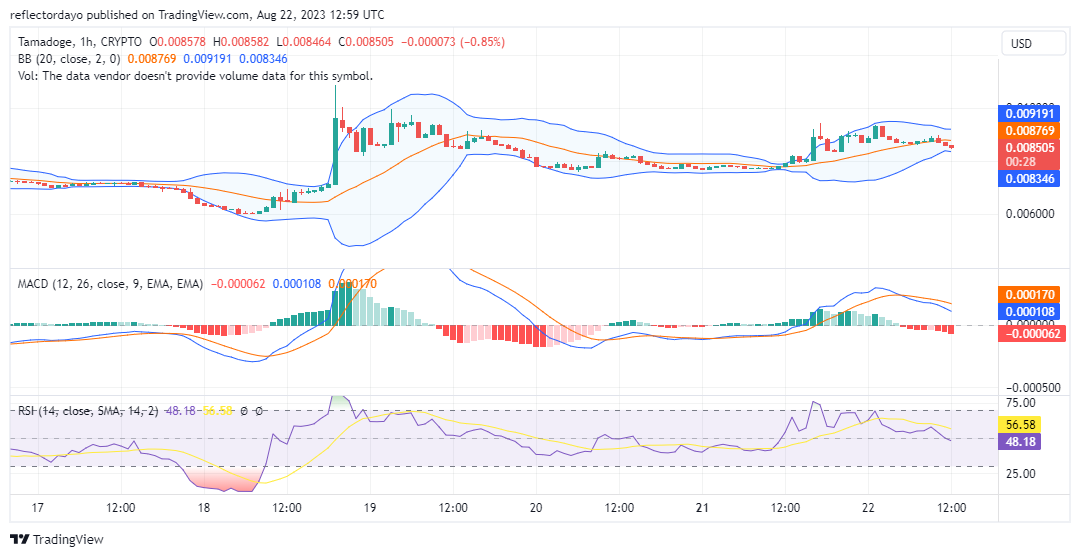
Tamadoge Short-Term Outlook: 1-Hour Chart
On a shorter timeframe, the market signals seem to be converging towards equilibrium. As per the Relative Strength Index, the RSI line has retreated to approximately the midpoint of the indicator, specifically at a level of 48. At the price level of $0.00837, a potential support zone emerges. As the bear market nears this level, its momentum diminishes. Traders might congregate around this price point in an effort to initiate a market reversal.
Tamadoge games are available on both Android and iOS.
What’s your favourite Tamadoge Arena upgrade to take down those crazy critters? 🦔🐄
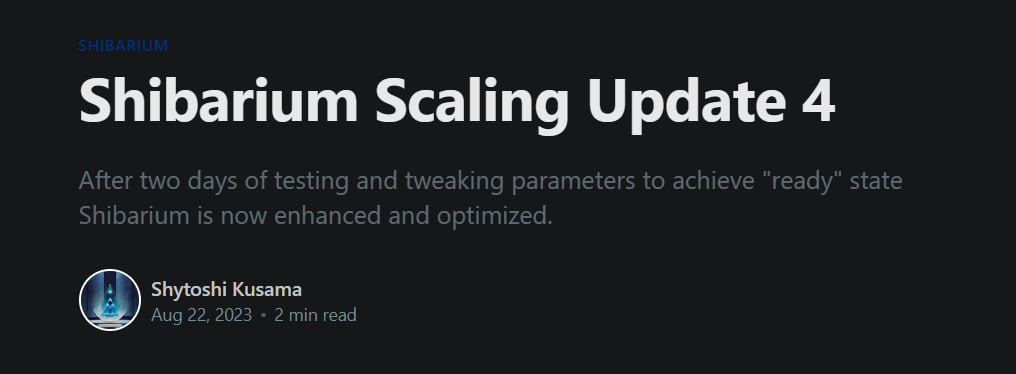
In an exciting turn of events, Shiba Inu’s much-anticipated blockchain project, Shibarium, is on the brink of a fresh launch attempt after facing initial technical challenges. Renowned as a meme coin sensation, Shiba Inu aims to rebound with its upgraded network designed to bring faster transactions and enhanced functionalities to its growing community.
Shibarium, a promising layer-2 solution, seeks to streamline transactions for Shiba Inu and its affiliated tokens like LEASH and BONE. The platform’s ambitious roadmap includes the integration of smart contracts, non-fungible tokens (NFTs), and decentralized applications, cementing its place in the wider Shiba Inu ecosystem.
Initial enthusiasm for Shibarium’s launch on August 16 was dampened by technical glitches and security vulnerabilities. The network experienced congestion due to a barrage of “spam transactions,” resulting in delays and disruptions. Adding to the chaos, issues suffered by Shibarium at launch reportedly led to at least $1.8 million in crypto funds getting stuck on the network.
Shytoshi Kusama Unveils Plans for Shibarium Relaunch
Image Source: Shiba Inu
Addressing these concerns head-on, lead developer Shytoshi Kusama unveiled an array of proactive measures in a recent blog post. The team’s introduction of a “dynamic fee system” promises to adjust transaction fees according to network demand, warding off spam attacks. Additionally, rigorous audits and enhancements to the bridge contract aim to bolster security, and the team has ensured restitution for the affected users.
Although Kusama refrained from disclosing an exact date for Shibarium’s relaunch, he assured the crypto community that the much-anticipated event was imminent. Moreover, he hinted at an array of forthcoming features and partnerships set to elevate the network’s functionality and adoption rates.
Excitingly, Shibarium plans to pioneer cross-chain interoperability, seamlessly connecting with other blockchain giants like Polygon and Binance Smart Chain. Collaborations with notable industry players such as SushiSwap and OpenSea are on the horizon, further cementing Shibarium’s significance in the evolving crypto landscape.
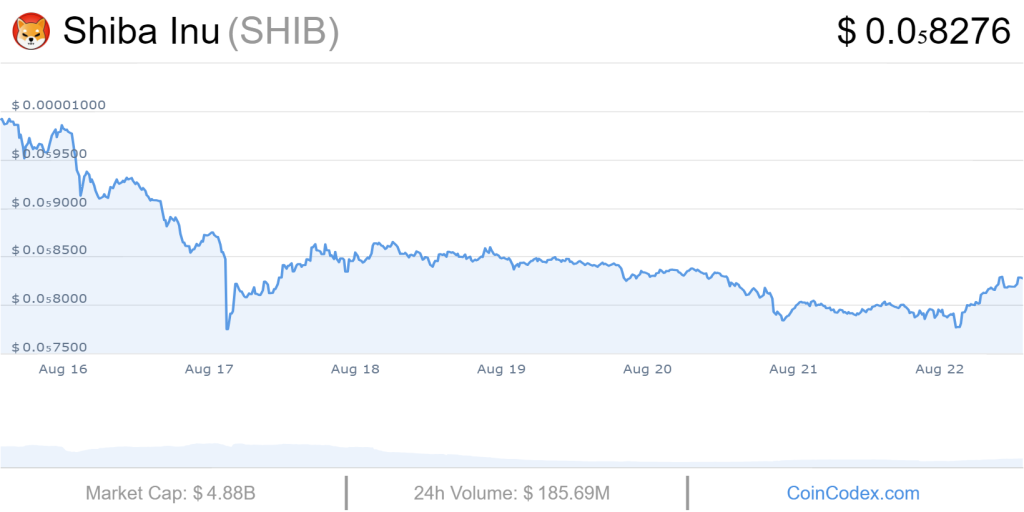
Anticipation is palpable among Shiba Inu enthusiasts, who eagerly await the Shibarium relaunch with hopes of bolstering both the coin’s value and its overall prominence. Currently trading at $0.0000079, SHIB has experienced a marginal 2% dip in the last 24 hours, as per CoinMarketCap data.
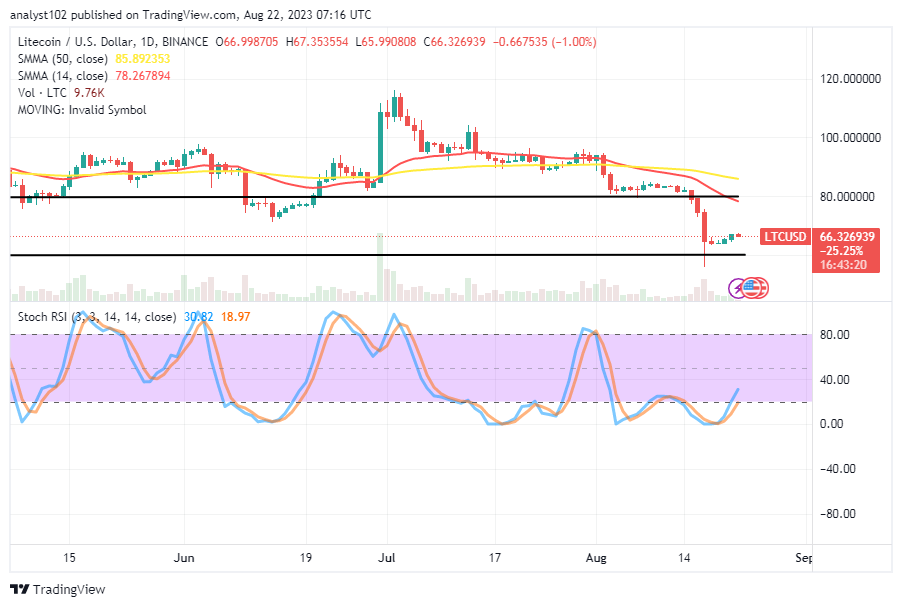
Litecoin Price Prediction – August 22 There have been financial reports stating that the LTC/USD market dumps, settling for rallying motions after making efforts to spring up from a reduction spot beneath the crucial point of $60.
Given that a rebound has been seen against the lower-trading spot of $60 going back approximately six days of operations to the present, buyers should be preparing to launch long-term position orders in light of the current deepening depth that the falling force has produced. The price is fluctuating close to $66.326939, maintaining a 1.00 percent downward percentage.
LTC/USD – Daily Chart The LTC/USD daily chart portrays the crypto market dumps from a logical trading spot of around $80 as a result of bulls’ ineptitude to form a firm baseline, and it is currently settling for a round of rallying motions at a lower trading spot of $60.
The 14-day SMA indicator is placed at $78.267894 in a southward-bending mode underneath the $85.892353 value of the 50-day SMA indicator. The stochastic oscillators have crossed northbound from the oversold region, positioning from 18.97 to 30.82 points. What pattern of pushes is likely to persist in the price for a while before we start to witness dependable returns in the valuation of LTC relative to the US coin? It is expected for the LTC/USD trade to resume sideways below the trend lines of the moving averages for some time before pushing into a definite direction as the cryptocurrency market dumps, settling for rallying motions around the point of $60.
A short line of lows is liable to occur around the value line of $60 purposely to produce reliable decent entries for long-position placers. Nevertheless, the current point of transaction could be a good moment for buying orders ahead of volatile moves that will be in favor of bulls afterward.
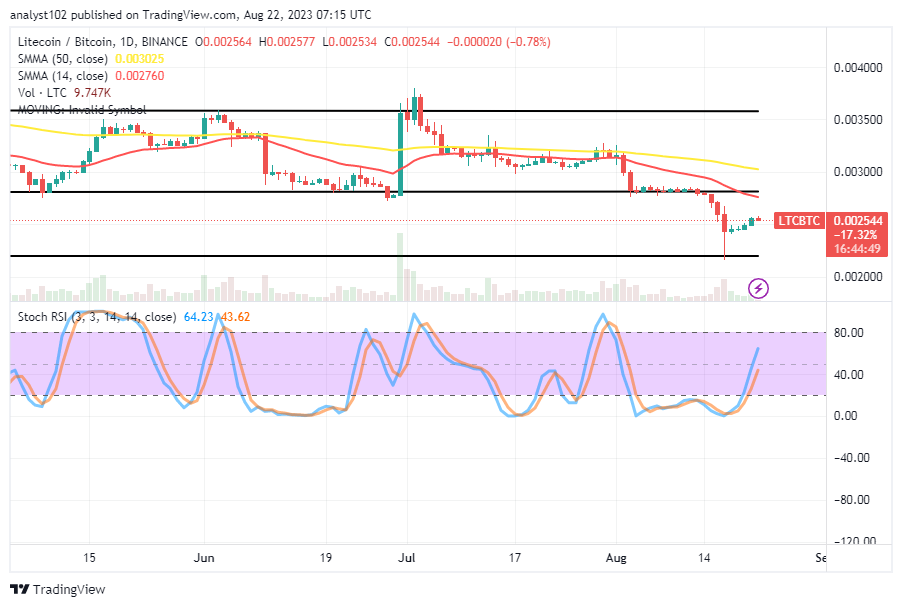
Even though there may be additional ways for prices to fall, decreases in size often don’t last any longer than is necessary. As a result, sellers should exercise extreme caution this time around when thinking about a new shorting order. LTC/BTC Price Analysis In contrast, the Litecoin transaction line dumps against the trending weight of Bitcoin, settling for rallying motions from the lower horizontal line drawn beneath the trend lines of the moving averages.
They are momentarily bent southward above the current trading zone, with the 14-day SMA indicator below the 50-day SMA indicator. From the oversold area, the stochastic oscillators have curved northward to remain between the values of 43.62 and 64.23. In order to issue a cautionary notice against having a dependable, smooth run to the topside, a smaller force has appeared to make a sluggish reversal signal.
Note:Cryptosignals.org is not a financial advisor. Do your research before investing your funds in any financial asset or presented product or event. We are not responsible for your investing results.
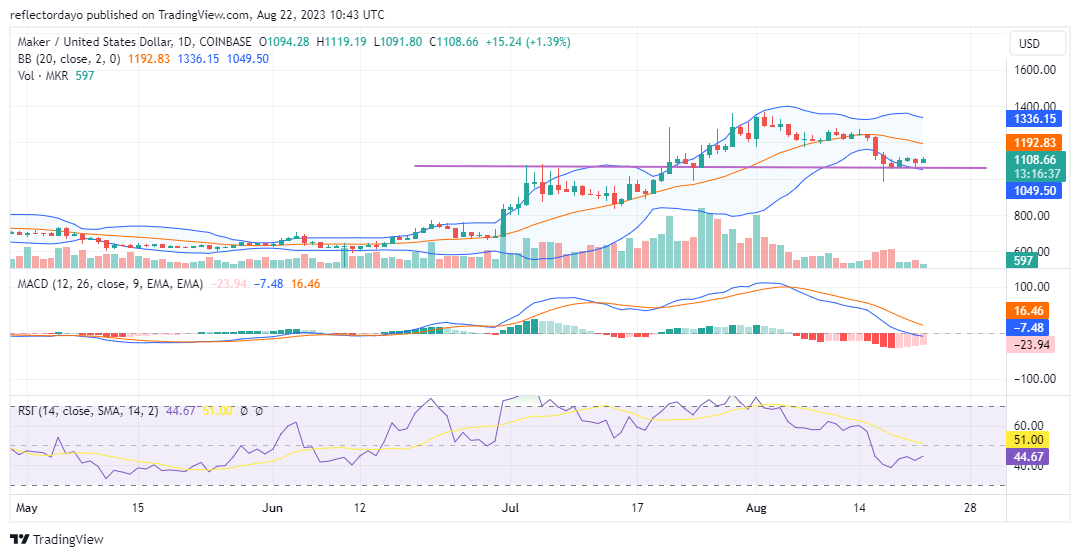
The price level of $1064 holds significant importance as a major demand zone. It is highly probable that the Maker market will experience a resurgence from this point on and proceed with its upward trajectory. When delving into historical data, it’s evident that the previous bullish rally was initiated precisely at this level on July 25. This led the market into a bullish phase that steered it toward the $1400 price point prior to the onset of the bearish market phase.
During this Maker bearish market period, a critical support point at $1064 played a pivotal role in halting the downward trend. Despite a test of the $1000 price mark by the bearish market, this attempt was swiftly rejected, causing the market to revert to the fundamental demand level at $1064. Should the pressure from the bearish side persist, the $1000 price level may emerge as the ultimate safeguard for maintaining the integrity of the ongoing bull market.
The Maker Market Data
MKR/USD Price Now: $1112.30
MKR/USD Market Cap: $1,083,964,093
MKR/USD Circulating Supply: 977,631 MKR
MKR/USD Total Supply: 977,631 MKR
MKR/USD CoinMarketCap Ranking: #41
Key Levels
Resistance: $1300, $1400, and $1450.
Support: $1000, $950, and $900.
Price Prediction for Maker: The Indicators’ Point of View
On August 16 and August 17, we observed pronounced bearish price action; however, the volume of trade indicator lacks the robustness necessary to substantiate the extent of the bearish candlesticks on these days. This suggests a decline in the potency of the bear market’s influence as they approach this key demand level.
The volume of trade indicator is a representation of the total number of shares or contracts traded during a specific time frame. Substantial or noteworthy volume typically corroborates the intensity of a price movement. In the context of a bearish trend, elevated volume amid a downward trajectory can signify heightened selling pressure, reinforcing the bearish price behavior. Nevertheless, when volume fails to meet expected levels of significance despite the presence of prominent bearish candlesticks, it could be indicative of waning bearish sentiment. This is where the concept of divergence comes into play. By identifying divergence, we can support the perspective that anticipates a price increase from the current level.
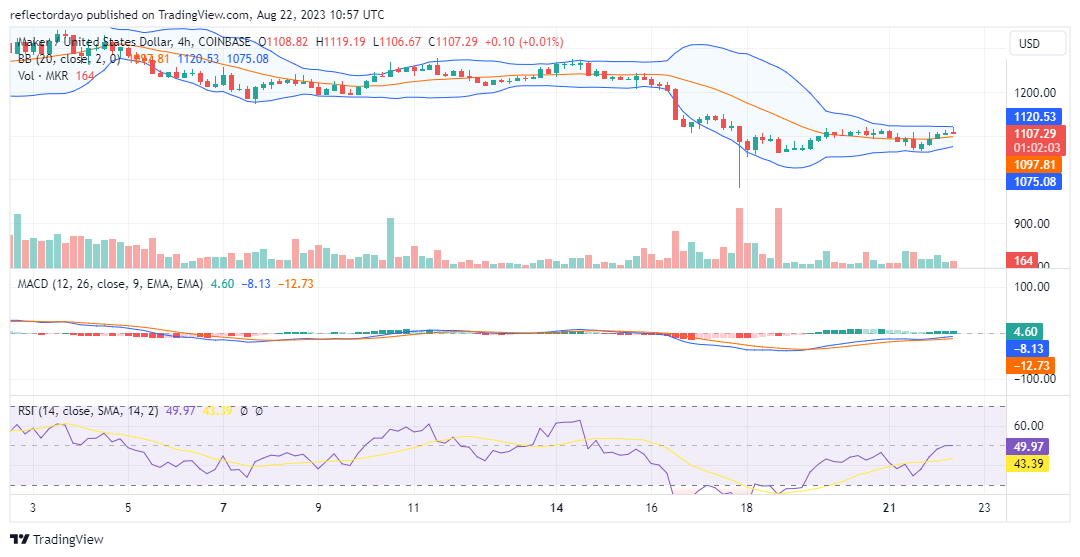
MKR/USD 4-Hour Chart Outlook
From this vantage point, the Bollinger Bands exhibit convergence, resulting in the formation of a notably narrow price channel. This phenomenon implies an impending breakout. Nonetheless, it’s worth noting that while the market has already commenced a bullish breakout, the bullish price movement hasn’t yet gained sufficient momentum, causing the market to remain confined within this constrained price channel.
Nevertheless, traders are advised to monitor the volume of trade indicator for validation before making investment decisions. In terms of the 4-hour chart perspective, despite the potential for a bullish price surge, the volume traded within the daily session remains subdued, thereby impeding the pace of recovery. Alternatively, the market might persist in ranging at its current level, potentially bolstering the strength of this particular price level.
Shiba Inu’s value has dropped to levels not seen since July 2022. However, it’s still about 29% higher than its lowest point in June. Similarly, Ethereum’s price, which had nearly doubled before the Merge, also fell by 25% shortly after the Merge. So, the decline in Shiba Inu’s value after the Shibarium launch isn’t unexpected or overly concerning.
Looking at the data for Shiba Inu’s 1000SHIB derivatives, there’s a positive outlook indicated by a 44.43% increase in trade volume, reaching $307.53 million. The majority of positions are long, as shown by Binance’s long/short account ratio of 3.2882. However, it’s worth noting that recent data on liquidation highlights a degree of risk. Over the past 24 hours, long positions have experienced significant losses of $203.75K, compared to shorts at $38.98K. This demonstrates the market’s inherent instability despite the ongoing optimistic trend.
What is Shiba Inu – Brief Overview
Shiba Inu was introduced quietly in August 2020 as an alternative to Dogecoin, often called the “Dogecoin killer.” Unlike Dogecoin’s standalone blockchain, SHIB operates on Ethereum’s blockchain, offering more potential uses in decentralized finance applications. The creator, known as Ryoshi, and the lead developer, Shytoshi Kusama, are key figures in the Shiba Inu project.
For about six months after its launch, SHIB remained relatively unknown. Its trading volume was quite low, often under $1,000 a day. Interestingly, it was Dogecoin’s remarkable price surge in early 2021 that propelled Shiba Inu into the spotlight. As crypto speculators sought the “next Dogecoin,” Shiba Inu emerged as a prime candidate.
Will Shiba Inu Reach 1 Cent – Analysis
The Shiba Inu community is well-organized and focused on delivering value, moving beyond being just a meme coin. In 2021, Shiba Inu surged 60 times in 6 months. Can it reach 1 cent? With 90% of its tokens burned, Shiba Inu would need to increase nearly 90 times in value to reach 1 Cent. At that point, its market capitalization would be $548 billion. If Shiba’s price were to rise by 25% annually, it would take about 11 years to reach 1 Cent. While this still seems challenging, the chances of achieving this goal improve noticeably.
The most likely path for Shiba to reach 1 cent is if around 95% of its tokens are burned within the next approximately 5 years. This would require a burn rate of about 15-20% each year. It’s a demanding objective to achieve.
Considering the available data:
Investment quality: Moderate
Growth needed for 1 cent: Not feasible
Market cap at 1 cent: Not feasible
Time at 25% growth: Not feasible
Thus, considering investment quality, required growth, and market cap, Shiba Inu can’t reach 1 cent. Now, let’s explore a scenario where 90% of tokens are burned.
SHIB Inu Potential for Upside 2023
While it’s unlikely that SHIB will reach 1 cent, there’s still potential for an upside. With SHIB’s price down 89% from its peak, current buyers are capitalizing on a dip. Shiba Inu has a solid foundation with many token holders and listings on major exchanges. In a crypto bull run, increased demand can easily drive SHIB’s value up. The team is actively enhancing SHIB’s appeal. Shibarium, a layer 2 scaling platform, will offer fast and cost-effective transactions for gaming and metaverse applications. It includes a token-burning mechanism.
Other projects like ShibaSwap, Shiboshis NFTs, and SHIB: The Metaverse are in the works, potentially boosting SHIB’s price if successful. Still, SHIB is often seen as a speculative meme coin, so broader favourable crypto market conditions are needed for substantial gains. There’s no assurance SHIB will regain its all-time high, especially since its price history is short (since 2020), making its behaviour across market cycles less predictable.
Based on an algorithm-generated forecast, Shiba Inu’s price might dip around -9.8% to $0.000008023 by June 22. After this, it’s predicted to rise to $0.00001080 in 3 months and potentially reach $0.00006102 by November, signifying a +585% increase from the current price.
Annually, Shiba Inu’s projected price is approximately $0.00003547, showing about a +300% rise from the current rate. Keep in mind, this prediction relies on technical indicators from May 2023 and could change significantly in the future.
It’s not probable for Shiba Inu to reach 1 cent soon given its current circulating supply. Shiba Inu’s overall market capitalization has been fluctuating between $6.8 billion and $7 billion recently. To achieve 1 cent, its market capitalization would need to be $5.8 trillion.
For perspective, Bitcoin’s market cap, which is above $20,000, is approximately $450 billion. Therefore, for SHIB to reach 1 cent, it would require a market cap larger than the combined value of Bitcoin, Ethereum, and all other cryptocurrencies.
Risks Likely to Occur
There’s an increased risk of regulations affecting the cryptocurrency industry, highlighted by the recent crashes of FTX and Luna. The introduction of Central Bank Digital Currencies (CBDCs) by central banks adds uncertainty to how cryptocurrencies will be impacted. Regarding development, the SHIB team is working on planned initiatives, but none have been fully executed yet.
The overall atmosphere is somewhat unfavourable for cryptocurrencies, especially non-utility coins like Shiba Inu. If the token’s price continues to drop, it could lead to reduced interest and potentially spell the end for Shiba Inu Token.
Shiba Inu Trading Volume Update
In recent months, Shiba Inu’s trading volumes have fluctuated: Mar – $260M, Apr – $206M, May – $106M, June – $129M, July – $126M, August – $364M. The game “Shiba Eternity” and upcoming projects like “Shibarium” and “Shibverse” have gained positive reviews on app stores. Notable partnerships with companies like Coingate, Bugatti, and VISA have expanded Shiba Inu’s ecosystem, potentially enhancing SHIB token use cases. Token burns and whale activity impact the token’s price, while recent burn and whale actions have influenced its value. Progress in these areas, along with favorable market conditions, could contribute to Shiba Inu moving closer to its 1-cent price target.
Conclusion
Predicting Shiba Inu’s price reach 1 cent is highly unrealistic due to the extreme market cap it would require ($5.89 trillion). Reaching $1 is even more improbable. But, this doesn’t rule out potential growth. If the crypto market enters a bull run, SHIB could surge, given its strong positioning with products like Shibarium and multiple exchange listings. The team’s efforts enhance its potential.
FAQs
Can Shiba Inu coin reach $1?
No, our prediction model doesn’t see the Shiba Inu coin reaching $1. It’s unlikely to even reach 1 cent based on the current situation.
Is Shiba Inu coin a good investment?
Yes, Shiba Inu has improved and become a thriving DeFi ecosystem, making it a good investment with potential growth due to its roadmap, partnerships, and community.
What is Shiba Inu price in 2023?
In 2023, Shiba Inu’s price might range between $0.0000087 and $0.0000098, as per our prediction.
What is Shiba coin value in 2025?
By 2025, Shiba Inu coin could trade between $0.000016 and $0.000020, according to our 2025 prediction.
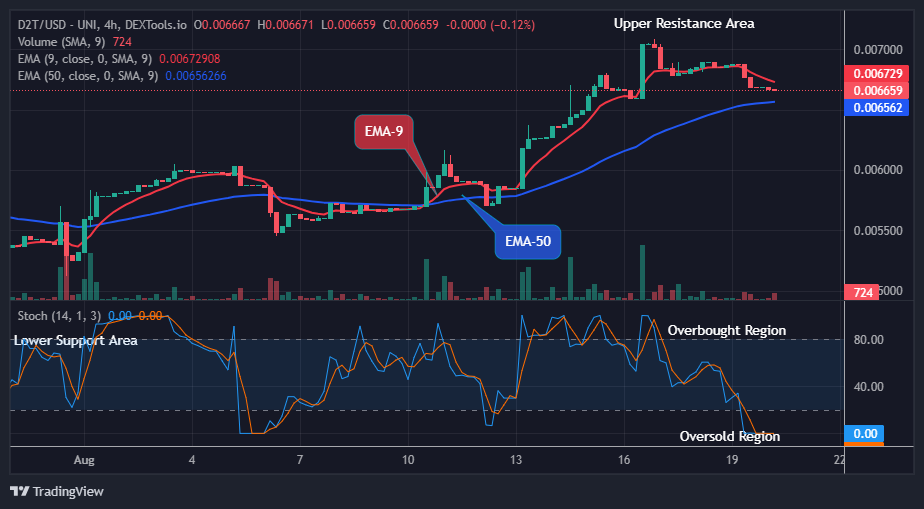
Dash 2 Trade Price Forecast: D2TUSD Price Will Jump Soon, Watch out for BUY! (August 22) The Dash 2 Trade price can jump soon as the crypto now reaches its bearish exhaustion preparing for the next jump. The selling pressure might end soon as usual and the coin price could be ready for an upward movement soon. If the buy investors could prove stronger and exchange hands with the sell traders at the $0.00665 support value, its upside trip could extend further to rechallenge the previous high of $0.00704 value. Then we can expect a shift in trend to reach a $0.01000 upper resistance level, resulting in intraday gains for the buy traders.
D2T (USD) Long-term Trend: Bearish (4H) D2TUSD indicates a downward trend with a bearish sentiment in its long-term perspective. The coin is trading below the two EMAs. However, the current trend will soon be nullified as the market now trades in the oversold region. The sustained bearish pressure at the $0.00668 support value has made the crypto price drop below the supply levels in recent times. However, there is about to be a turnaround for the coin buyers as the selling pressure seems exhausted at the moment.
The drop in the price of Dash 2 Trade to a $0.00665 low value as the 4-hourly chart commenced today has no serious effect on the market as the price remains in an uptrend. Hence, staying above the supply levels indicates a strong possibility for a bullish correction.
Moreover, the seller’s failure to offer a follow-up to the breakdown candle also adds to some weakness in bearish momentum. If buyers stepped into this uncertainty, the coin price may jump up and rise above the $0.00704 previous swing high, leading to greater profits for the coin buyers.
Meanwhile, there is a possibility of a price reversal at the mentioned support level as the market is now pointing downward below the 5% range of the daily stochastic. This means that the selling momentum will end soon and the time to gain more strength by buyers is near.
The next bullish correction phase could reach a high at the $0.01000 upper supply mark in the days ahead as we watch the D2TUSD market turns bullish sooner in its long-term outlook.
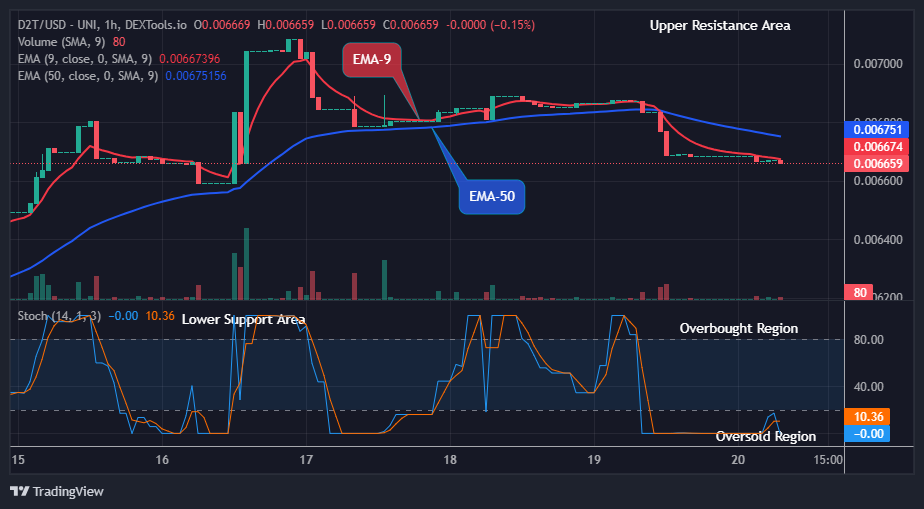
D2T (USD) Medium-term Trend: Bullish (1H) The coin also trades in a bearish trend market in the medium-term outlook. This is due to the high impact of short-term traders on the price flow. The sell traders made a downward move to the $0.00668 support level before the end of yesterday’s session. This gave sellers more strength to drop the price of Dash 2 Trade below the supply trend lines in its recent low.
Earlier today, the bulls made an increase to the $0.00667 supply value after which the sell traders intervened and dropped the coin price down to a $0.00665 low value below the two EMAs.
Thus, the coin prices will likely jump soon as the market is oversold already. Meanwhile, traders may use this opportunity to buy the coin at the current trend at a lower rate for future gains.
Additionally, the price of D2TUSD is also at the oversold region of the daily signal, this suggests that the coin price might retrace from the current support at the $0.00665 level and resume its upward rally; this could reach a high at $0.01000 upper supply value in the days ahead in its medium time frame.
The Dash 2 Trade community is optimistic for the coming month on Twitter and Discord. In 20 days, let’s review how everyone did.
APEUSD Analysis: The Market Retraces Upward For A Short Time As Price Leaves The Discount
APEUSD retraces upward shortly as the price leaves the discount zone. Since the breakout to the downside in April 2023, the market has been completely overwhelmed by selling pressure. As revealed by the RSI (Relative Strength Index), the APEUSD is in a discount zone. A bullish expansion is imminent, as the price needs to retrace for a while.
According to the Moving Averages, APEUSD collapsed as April ended. The indication was due to the bearish cross of the Moving Averages for periods 18 and 40. The downtrend continued along with a falling trendline, which emerged after a bounce off the $4.750 resistance. Since the breakout in April, the price has failed to make a significant retracement into the premium zone. Since the downtrend began, the market has barely breached the 50.0 RSI level.
The difficulty in breaking the 50.0 RSI level to the upside is due to the overwhelming selling pressure from the premium zone. On June 4, 2023, a surge into the FVG (Fair Value Gap) occurred, and a resumption of the downtrend followed just immediately. Similarly, on June 25, 2023, APEUSD also crashed further after a tap into the internal liquidity of the trading range. The falling trendline eventually broke as the price crossed over to the other side of the trendline. Following a buy-side liquidity grab above $2.100, APEUSD declined into the discount zone.
Market Expectation
On the four-hour chart, the market’s trading range is currently between $2.120 and $1.350. During the crash into the discount zone, an FVG formed around the $1.900 price level. As the market leaves the discount zone, APEUSD is expected to keep expanding upward until the FVG is reached.
Note: Cryptosignals.org is not a financial advisor. Do your research before investing your funds in any financial asset or presented product or event. We are not responsible for your investing results.
ApeCoin (APEUSD) Retraces Upward As Price Leaves The Discount
ApeCoin (APEUSD) Retraces Upward As Price Leaves The Discount