Ethereum Pauses above $1,600 as Traders Show Disinterest in the Market Direction

Ethereum Price Long-Term Analysis: Bearish
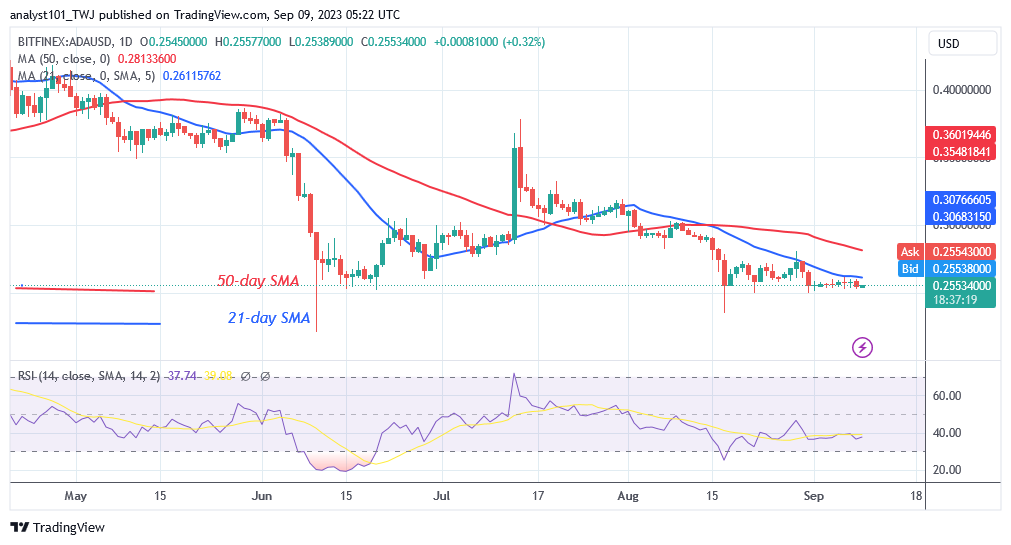
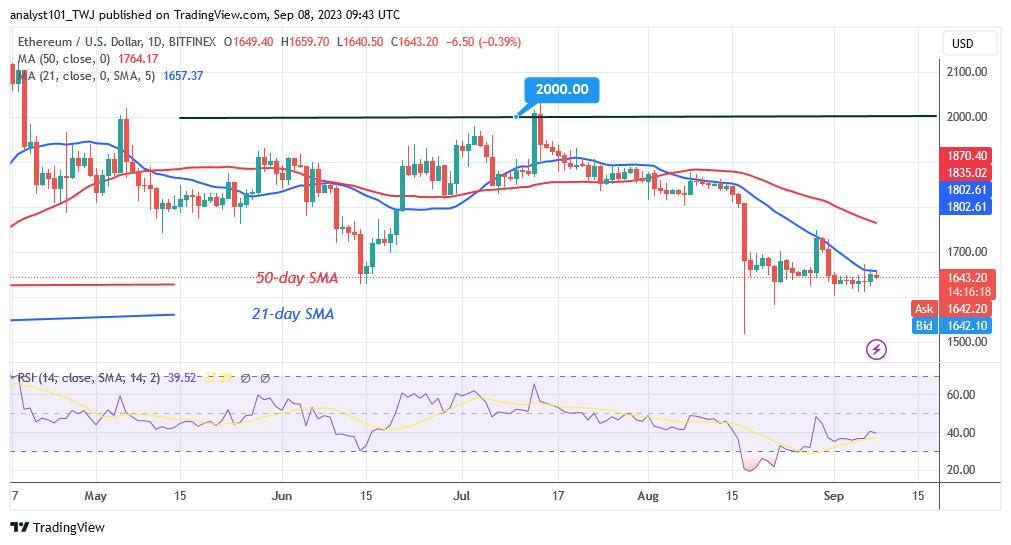
Ethereum (ETH) price has remained stable above the $1,600 support level as traders show disinterest in the market direction. The largest altcoin has not changed in price because the Doji candlesticks have restrained price movement. Doji candlesticks represent buyers’ and sellers’ disinterest in market direction.

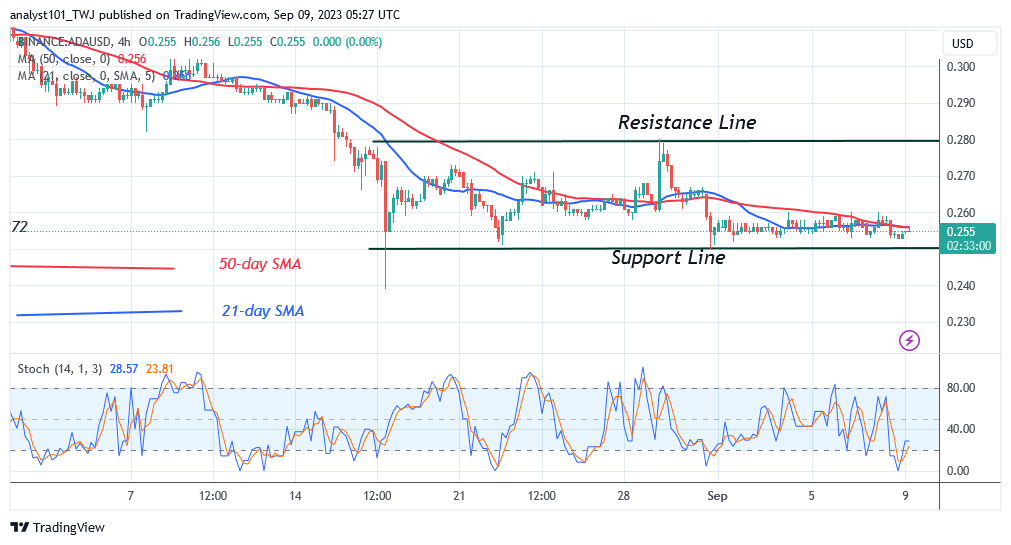
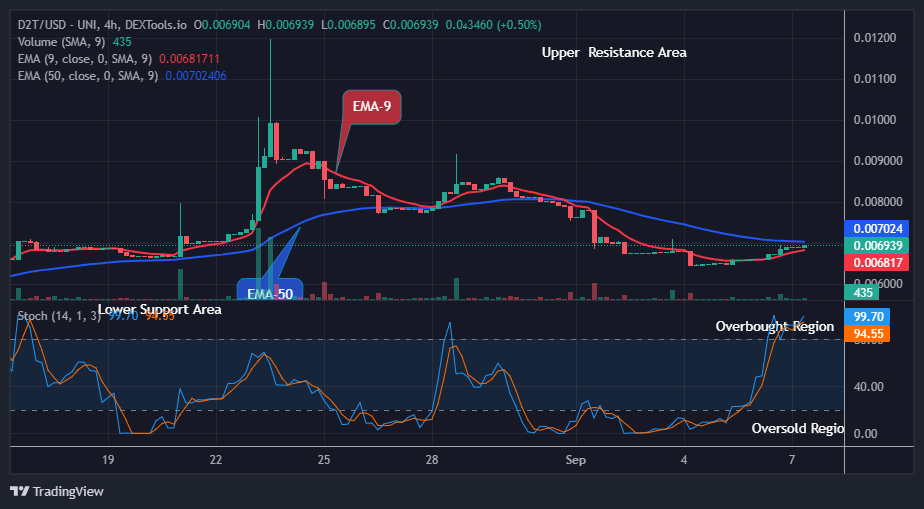
ETH/USD is also stuck since the 21-day SMA is impeding its upward movement. Currently, the price range has been reduced to $1,600 and $1,660. If Ether rebounds above the current support, it will rise above the moving average lines. The bullish trend will continue until the high of $1,800. On the negative side, the pricing range has been marked by extended candlestick tails.

This shows that there is a lot of buying going on at cheaper prices. If the current support is breached, the altcoin’s value will fall.

Ethereum Pauses above $1,600 as Traders Show Disinterest in the Market Direction
ETH/USD – Daily Chart


Technical indicators:
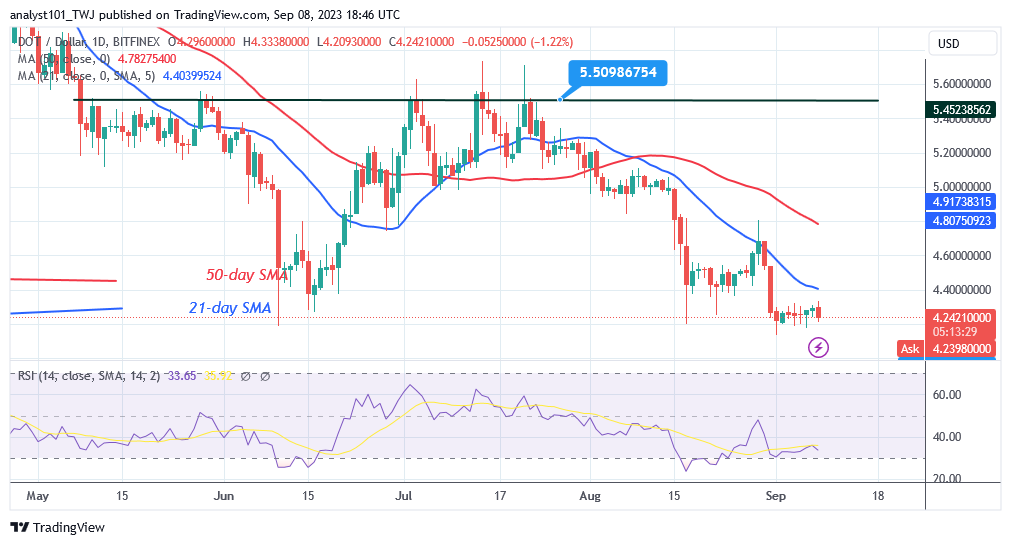
Major Resistance Levels – $2, 600, $2,800, $3,000
Major Support Levels – $1.600, $1, 400, $1,200

Ethereum Indicator Analysis
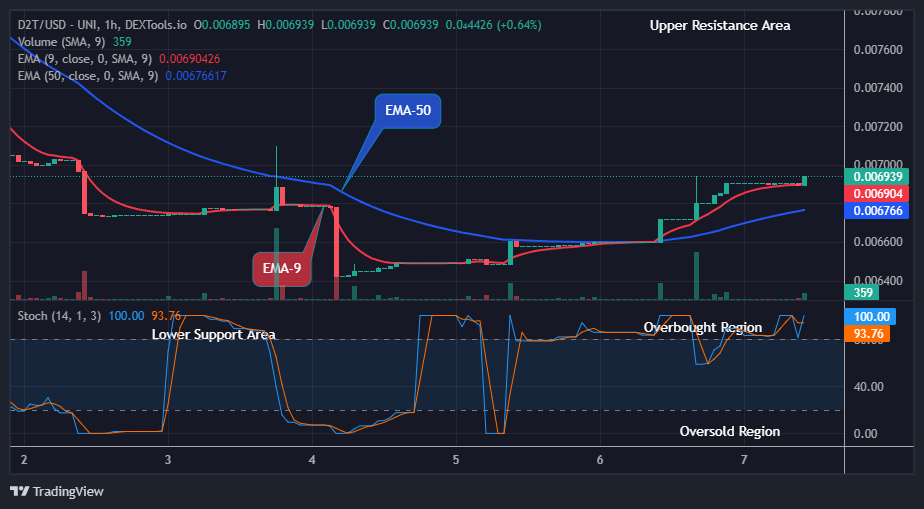
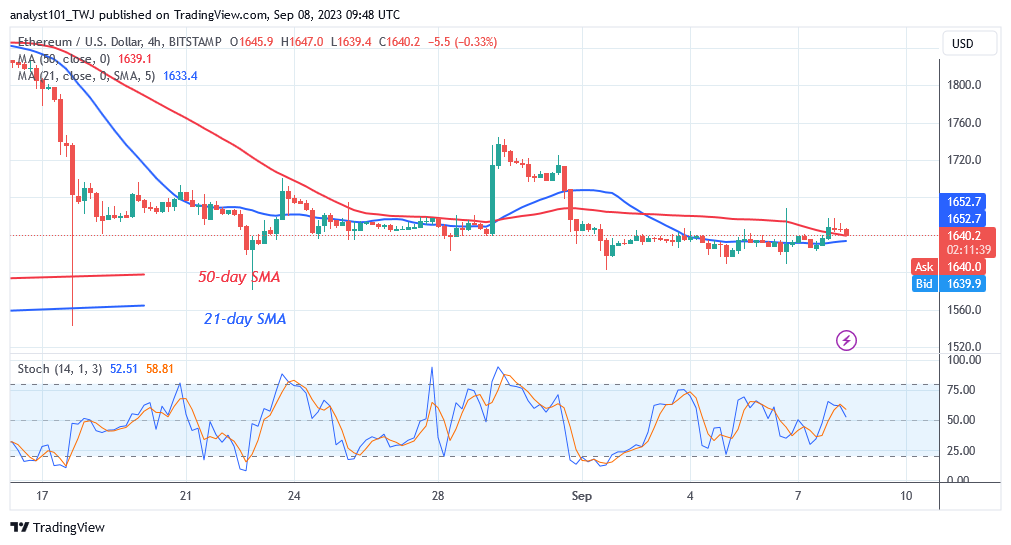
Ether’s drop has paused above the Relative Strength Index level of 38. As it approaches the oversold region, the altcoin is stuck in the bearish trend zone. The 21-day SMA has served as a price bar resistance line. A break above the moving average lines indicates that the uptrend has resumed. The bearish momentum has paused below the daily Stochastic level of 40.

Conclusion
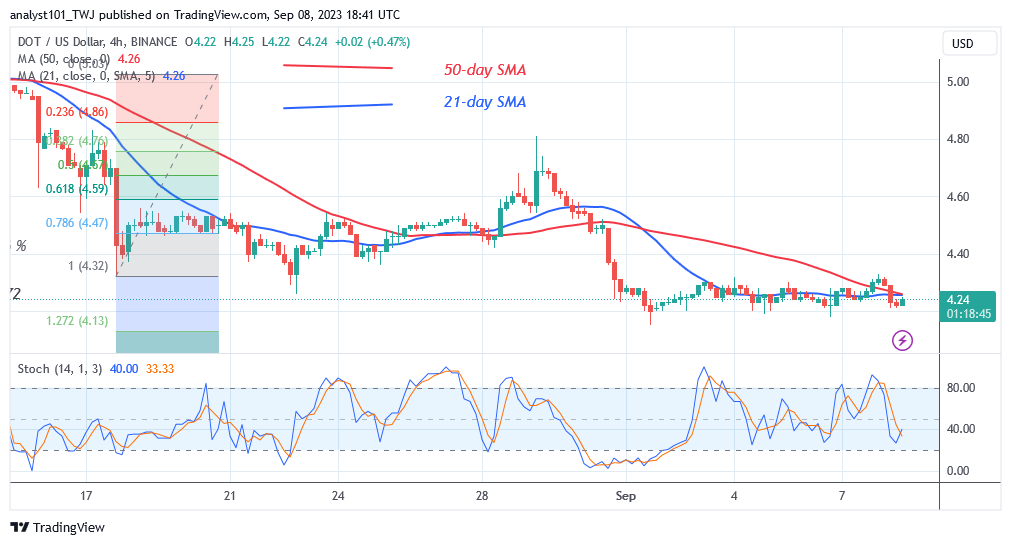
Ethereum is in a horizontal trend on the 4-hour chart as traders show disinterest in the market direction. The pricing bars are within a narrow range. The cryptocurrency is currently trading in a range between $1,600 and $1,660. Nonetheless, the market’s direction is unknown due to the presence of candlesticks.

Ethereum Pauses above $1,600 as Traders Show Disinterest in the Market Direction
ETH/USD – 4 Hour Chart

You can buy crypto coins here. Buy LBLOCK

Note: Cryptosignals.org is not a financial advisor. Do your research before investing your funds in any financial asset or presented product or event. We are not responsible for your investing results

Compound (COMPUSD) Retraces Upward As The Third Impulse Swing Ends

COMPUSD Analysis: The Market Retraces Upward As The Third Impulse Swing Ends

COMPUSD retraces upward as the third impulse swing ends. The prior trend was bullish until the retraction of the price at the $86.00 resistance. The market is currently in a consolidation phase as it entered an oversold state, according to the Stochastic Oscillator. The overall trend is likely to remain bearish since the COMPUSD market has yet to make its final impulse to the downside.

COMPUSD Significant Zones
Demand Zones: $23.20, $3.00
Supply Zones: $54.60, $86.00

Compound (COMPUSD) Retraces Upward As The Third Impulse Swing Ends

According to the MA Cross, the market reluctantly entered the discount zone in June 2023. The decline brought the price into the $23.20 demand zone, after which the bulls seized control of the market. An impulsive upswing followed, invalidating all resistance levels until the price hit the $86.00 resistance. Owing to the overbought indication of the market at the premium, COMPUSD aggressively declined to create a new low. The new low formed at $58.30 marked the end of the first phase of the emerging bearish trend.

An upward expansion occurred, but only to face overwhelming selling pressure at the rejection block in the premium zone. The third impulse swing, which might be the longest wave, began immediately after. COMPUSD kept sinking due to overwhelming selling pressure as the market’s structure shifted downward. As revealed by the Stochastic Oscillator, the third impulse swing dragged the price into the oversold region. The bulls stormed the market afterward, causing an equilibrium moment in the market as the price now consolidated within a close range.

Compound (COMPUSD) Retraces Upward As The Third Impulse Swing Ends

Market Expectation

On August 31, 2023, COMPUSD entered an oversold state according to the Stochastic Oscillator. On the four-hour chart, an FVG (Fair Value Gap) formed as the price headed downward to conclude the third impulse swing. Probably, a return to the FVG will occur before the price resumes its downtrend.

You can purchase Lucky Block here. Buy LBLOCK

NoteCryptosignals.org  is not a financial advisor. Do your research before investing your funds in any financial asset or presented product or event. We are not responsible for your investing results.

SPONGE/USD ($SPONGE) Primed for an Upside Breakout

$SPONGE has exhibited a degree of price stability, maintaining its position in the vicinity of the $0.00010 price level. Market fluctuations have remained limited. Furthermore, given the ongoing consolidation near the critical $0.00010 demand level, there is an increased likelihood of an upward price breakout.

Key Levels

  • Resistance: $0.000115, $0.000120, and $0.000125.
  • Support: $0.00010, $0.000090, and $0.00008.

SPONGE/USD ($SPONGE) Primed for an Upside Breakout

Sponge (SPONGE/USD) Price Analysis: The Indicators’ Point of View

One noteworthy development is the emergence of a potential $SPONGE bullish divergence. This can be observed in the oscillatory RSI line, which is exhibiting a tendency to rebound from higher levels as it approaches the critical 50 mark. This suggests strengthening buying pressure, indicating a possible shift out of the sell zone.

Additionally, the Moving Average Convergence and Divergence (MACD) indicator supports this potential bullish divergence. The MACD lines are on an upward trend, originating from below the zero level, indicating a shift in market sentiment. This suggests that the bears might be losing their grip, further reinforcing the possibility of a bullish breakout.

SPONGE/USD ($SPONGE) Primed for an Upside Breakout

$SPONGE Short-Term Outlook: 1-Hour Chart

Despite these positive indicators, it’s important to note that actual price activity has yet to reflect this upward trajectory. Therefore, it’s crucial to monitor the price action closely in the coming days.

Given the current technical signals, there is an increased likelihood of a bullish breakout in the upcoming week. Traders and investors should keep a watchful eye on price movements and consider setting appropriate entry and exit points to capitalize on potential opportunities. As always, it’s advised to use risk management strategies to mitigate potential losses.

Buy SPONGE/USD and soak up the damp.

Invest in the hottest and best meme coin. Buy Sponge ($SPONGE) today!

Tamadoge (TAMAUSD) Settles Above the $0.012 Price Mark

After Tamadoge reached the $0.00011 price level, it subsequently ascended to attain the $0.01200 price mark. At this point, relentless buying pressure had driven the market to sell at a price exceeding its intrinsic value. Combined with the $0.013 price target, this initiated a corrective phase, leading the market to retrace from the $0.0130 price level to $0.0125.

At present, the market appears to be consolidating around the $0.012 price level, suggesting the emergence of a potential support level at the current price point. This newly formed support level has the potential to sustain the prevailing market trend, potentially enabling the market to breach the $0.013 price threshold.

Key Levels         

  • Resistance: $0.013, $0.014, and $0.015.
  • Support: $0.010, $0.0091, and $0.0087.

Tamadoge (TAMAUSD) Settles Above the $0.012 Price Mark

TAMAUSD Price Analysis: The Indicators’ Point of View

It’s crucial for the Tamadoge bulls to secure support at the current price to uphold the bullish momentum and reach the $0.013 price target. Nonetheless, some traders might eye the $0.013 level for profit-taking, potentially elevating bearish sentiment around that point. However, if the prevailing bullish sentiment persists, the market may consolidate in the $0.0124 to $0.013 range.

Indicators are already signaling a potential rebound around the current price level. A four-price doji represents the current 4-hour session, while the Relative Strength Index shows sideways momentum. This indecision could contribute to a consolidation pattern, fortifying support at this level for a potential trend continuation.

Tamadoge (TAMAUSD) Settles Above the $0.012 Price Mark
Tamadoge Short-Term Outlook: 1-Hour Chart

In the 1-hour timeframe, the price retracement appears to have extended quite a bit, with the price dipping below the 20-day moving average before entering a sideways range. Nevertheless, the price channel indicated by the Bollinger Bands remains in an upward trend, with the price trading near the lower standard deviation. This convergence of the Bollinger Bands suggests that momentum is gathering for a potential breakout, raising hopes for a price rally back to the $0.013 level.

We are happy to inform you that the Tamadoge Burn Portal is now operational.

Do you want a coin that will be 100 times more valuable in the next few months? That is Tamadoge. Buy TAMA today!

Cardano Loses Traction As It Maintains Its Position Above $0.25

Cardano (ADA) Price Long-Term Forecast: Ranging
The Cardano (ADA) price has remained constant in its range while maintaining its position above $0.25. The ADA price has been range-bound between $0.25 and $0.27 for the past few weeks. Cardano is now trading at $0.254 at the time of writing. The 21-day SMA and resistance at $0.26 have restricted price increases.

In recent times, the Doji candlesticks have also curbed price movement. Cardano is now trading in a narrow range between $0.25 and $0.26 per token. The current price range has the potential to lead to a price rebound or breakout. The bears have had the upper hand as the cryptocurrency has been declining modestly.

Cardano will drop and retest its previous low of $0.23 if the current support is broken. A price bounce is likely if buyers continue to defend the existing support. The altcoin will soar over the moving average lines and peak at $0.31.

 Cardano Loses Traction As It Maintains Its Position above $0.25
ADA/USD – 4 Hour Chart

Technical Indicators:
Major supply zones: $1.0, $1.05, $1.10
Major demand zones: $0.25, $0.20, $0.15

Cardano (ADA) Indicator Analysis
The altcoin has been restrained above the Relative Strength Index period 14 level 36. In the bearish trend zone, the altcoin is progressively dropping. The altcoin is losing momentum as it goes below the daily Stochastic threshold of 20. It suggests that additional selling pressure is unlikely.

What Is the Next Move for Cardano (ADA)?
Cardano will continue to trade sideways as it maintains its position above $0.25. Price movement will be minimal above the existing support. Additionally, the market has oversold at this point. In the oversold area, buyers may show up, restarting the upward trend.

 Cardano Loses Traction As It Maintains Its Position above $0.25
ADA/USD – 4 Hour Chart


You can purchase crypto coins here. Buy LBLOCK

Note: Cryptosignals.org is not a financial advisor. Do your research before investing your funds in any financial asset or presented product or event. We are not responsible for your investing result

Solana (SOL/USD) Price Is Debasing, Looking for Support

Solana Price Prediction – September 9
A chain of resistance has been staged around the $22 line, as confirmed by the crossing of indicators, given that the SOL/USD price is debasing and looking for support toward the point of $18.

The lingering falling pressure does not seem to have a significant impact on bulls’ potential to regain energy from around $18 ahead of anticipated rallying pressures. Prior to abandoning long positions in a shorting position order, plus and minus, investment strategy, and buying positions are to be initiated. .

SOL/USD Market
Key Levels:.
Resistance levels:$22, $24, $26
Support levels: $18, $16, $14

SOL/USD – Daily Chart
The SOL/USD daily chart showcases that the crypto-economic price is debasing beneath the interception of the SMAs, looking for support averagely above the spot price of $18.

As the positions of the moving averages have been set above at a great distance, the horizontal line has been drawn to show an underlying important point around the $18 support to indicate that sellers will probably not be able to push and hold for long underneath. The 50-day SMA is positioned below the 14-day SMA. Between 43.09 and 39.45, the stochastic oscillators are slightly crossing southward.
Solana (SOL/USD) Price Is Debasing, Looking for Support
What is the most likely trend that the SOL/USD market will continue to follow?
Trade arenas between the points of the moving averages and the horizontal line drawn at a lower point of $18 will likely witness variant ranges in the following days, given that the SOL/USD market is debasing and looking for support toward the value line.

Long-position pushers should be cautious in their approaches at this stage and wait for an active rallying motion before entering a buy order. The current state of affairs indicates that the catalytic procedure will continue as long as the $18 support line is not crossed at the finish line.

As of the time this technical analysis was written, immediately executing a shorting order would put you in danger of quickly witnessing a comeback. Therefore, sellers should immediately set up a stop-loss order, particularly a little above the SMAs’ trend lines, to prevent unwarranted losses.
Solana (SOL/USD) Price Is Debasing, Looking for Support
SOL/BTC Price Analysis
In contrast, Solana has slightly remained debasing against Bitcoin below the positioning stances of the moving averages, looking for support.

Closely positioned above the 50-day SMA trend line is the 14-day SMA trend line. From 50.83 to 43.03, the stochastic oscillators are attempting to cross back southward. The creation of the candlesticks at this time has been dominated by smaller bearish types. A bullish candlestick tending to occur at a given time will decimate the possibility of seeing further debasements in whatever method. Therefore, buyers should stay alert while that assumption appears.

Note: Cryptosignals.org is not a financial advisor. Do your research before investing your funds in any financial asset or presented product or event. We are not responsible for your investing results.

You can purchase Lucky Block here. Buy LBLOCK

Dash 2 Trade Price Predictions for Today, September 9: D2TUSD Price Remains Pressured above the $0.00689 High Level

Dash 2 Trade Price Forecast: D2TUSD Price Remains Pressured above the $0.00689 High Level (September 9)
D2TUSD at the moment is trying hard not to fall by resisting sellers. The coin is bound to gain more strength for another upward move potential as it remains pressured above the supply trend levels. In case the bulls’ pressure breaks up the resistance level of $0.01197, the coin price may increase further to a $0.10000 high trend line which indeed will be a turnaround for the coin holders.

Key Levels:
Resistance levels: $0.01000, $0.01100, $0.01200
Support levels: $0.00800, $0.00700, $0.00600

D2T (USD) Long-term Trend: Bullish (4H)
D2TUSD remains bullish on the higher time frames. This is clear as we can see the prices trading above the two EMAs losing bearish momentum.
Dash 2 Trade Price Predictions for Today, September 9: D2TUSD Price Remains Pressured above the $0.00689 High Level
Buyers caused a rise to a $0.00671 high level above the moving averages during yesterday’s session and sustained it. This has made it possible for the Dash 2 Trade to remain in an uptrend in its recent price level.

Its resistance was broken up again at $0.00689 and later rose to a $0.00693 high level above the two EMAs as the 4-hourly chart opens today, resulting in an intraday gain for the coin holders.

Thus, if buyers should increase their price action, and bullish momentum is sustained above the $0.01197 previous swing high, further bearish thesis would get invalidated while buyers will focus on the ultimate breakout to the $0.1000 upper resistance level and beyond.

Next, there is a possibility for the D2TUSD pair to grow further as indicated by the daily signal pointing upwards. In light of this, the coin price might possibly grow higher to reach the $0.1000 supply value in the coming days in its long-term outlook.

D2T (USD) Medium-term Trend: Bullish (1H)
The coin price still trades in a bullish market in its medium-term perspective. At the time of writing, the price of D2TUSD opened higher and also traded in green above the supply levels, this means that the coin is in a bullish trend zone.
Dash 2 Trade Price Predictions for Today, September 9: D2TUSD Price Remains Pressured above the $0.00689 High Level
The bulls acted bravely during yesterday’s session by pushing the price of Dash 2 Trade to the $0.00660 high value which enhanced the crypto price to remain strong above the supply trend levels in its recent high.

The price of D2TUSD at a $0.00693 resistance value which is above the two EMAs as the 4-hourly chart opens today indicates an uptrend and more bullish impact on the coin.

Thus, additional efforts by the long-term traders above the $0.00709 value will make it possible for the coin price to rise further.

Notably, the price of Dash 2 Trade indicates an uptrend on the daily signal; hence, there is a possibility of further increase in the price of the crypto.

If the buy traders should increase their price actions and all the current support level holds, a psychologically key level at $0.1000 at the upside might be reached soon in its medium-term time frame.

Completed integration tests, worked on planned additions, improved error handling, repaired D2T chart problems, and optimized speed.


Want a coin that has a huge potential for massive returns? That coin is Dash 2 Trade. Buy D2T now.

SPONGE/USD ($SPONGE): Anticipating a Possible Reversal Around $0.00010

SPONGE/USD has been in a prolonged consolidation phase, maintaining its price around the $0.0001030 mark. Recent market developments have captured the attention of traders and analysts alike. Towards the end of August, a significant bull run surged, pushing the market to a peak at $0.000109. This rally sparked notable buying interest and instilled a positive sentiment among market participants.

Following this peak, the market retraced to the $0.0001030 level in the early days of September. This correction is considered a natural response after a strong bullish upswing.

Key Levels

  • Resistance: $0.000115, $0.000120, and $0.000125.
  • Support: $0.00010, $0.000090, and $0.00008.

SPONGE/USD ($SPONGE): Anticipating a Possible Reversal Around $0.00010

Sponge (SPONGE/USD) Price Analysis: The Indicators’ Point of View

While it seems that bearish pressure has caused a minor shift in the support level of SPONGE/USD from $0.0001030 to $0.0001022, there are indications suggesting a potential imminent breakout. The Relative Strength Index (RSI) is approaching the 50 level, which acts as a midpoint indicator. Additionally, the MACD lines are nearing a crossover above the zero level, hinting at a potential divergence. These developments could provide strong signals for considering a long trade.

SPONGE/USD ($SPONGE): Anticipating a Possible Reversal Around $0.00010

$SPONGE Short-Term Outlook: 1-Hour Chart

In the recent daily trading session, a significant increase in trading volume was noted during one of the 1-hour sessions, although it did not notably affect the candlestick formation. This occurrence can be interpreted as a positive sign, indicating growing bullish interest. However, the ongoing struggle continues into today’s trading session. Buyers may hold an advantage in the potential breakout, given the convergence happening within bullish territory.

Buy the SPONGE/USD and soak up the damp.

Invest in the hottest and best meme coin. Buy Sponge ($SPONGE) today!

Polkadot Slides As It Returns To Its Previous Low of $4.13

Polkadot (DOT) Long-Term Analysis: Bearish
Polkadot’s (DOT) price dropped to the bottom of the chart on September 1 as it returned to a previous low of $4.13. DOT price fell to a low of $4.13 before pulling back to resume consolidation. This new drop has further narrowed the pricing range to $4.13 and $4.40. The present price level of $4.13 corresponds to the historical price levels of June 10, 2023, and December 28, 2022.

Today, DOT/USD is sliding and has returned to its prior low of $4.13. If the current support holds, DOT/USD will move between $4.13 and $4.40. On the downside, if the bears break through the existing support, the market will fall to a low of $4.00.

 Polkadot Slides As It Returns To Its Previous Low of $4.13
DOT/USD – Daily Chart

Technical indicators:
Major Resistance Levels – $10, $12, $14
Major Support Levels – $6, $4, $2

Polkadot (DOT) Indicator Analysis
The recent decrease has pushed the cryptocurrency to the Relative Strength Index level of 30 for period 14. The price signal indicates that the coin is in the market’s oversold zone. The crypto’s price drops when the moving average lines repel the price bars. A probable fall is indicated by price bars that are below the moving average lines.

The altcoin is in a negative trend below the daily Stochastic threshold of 40.

What Is the Next Direction for Polkadot (DOT)?
Polkadot has reached bearish exhaustion as it returns to its previous low of $4.13. The pricing range is now between levels $4.13 and $4.40. When these levels are breached, the altcoin will trend.

 Polkadot Slides As It Returns To Its Previous Low of $4.13
DOT/USD – 4 Hour Chart


You can purchase Lucky Block here. Buy LBLOCK

Note: Cryptosignals.org is not a financial advisor. Do your research before investing your funds in any financial asset or presented product or event. We are not responsible for your investing results