Dash 2 Trade Price Predictions for Today, December 26: D2TUSD to Increase to the $0.01000 High Value

Dash 2 Trade Price Forecast: D2TUSD to Increase to the $0.01000 High Value (December 26)

The D2TUSD price can keep rising and may increase the $0.01000 high value. The coin is now facing the upper resistance level and may likely continue with the high buying pressure provided buyers don’t give up and increase their momentum pressure in the market. The coin might surge to hit the $0.00460 peak value and extend beyond that to reach the $0.01000 upper resistance level, resulting in an intraday gain for coin traders.

Key Levels:
Resistance levels: $0.00125, $0.00126, $0.00127
Support levels: $0.000750, $0.000700, $0.000650

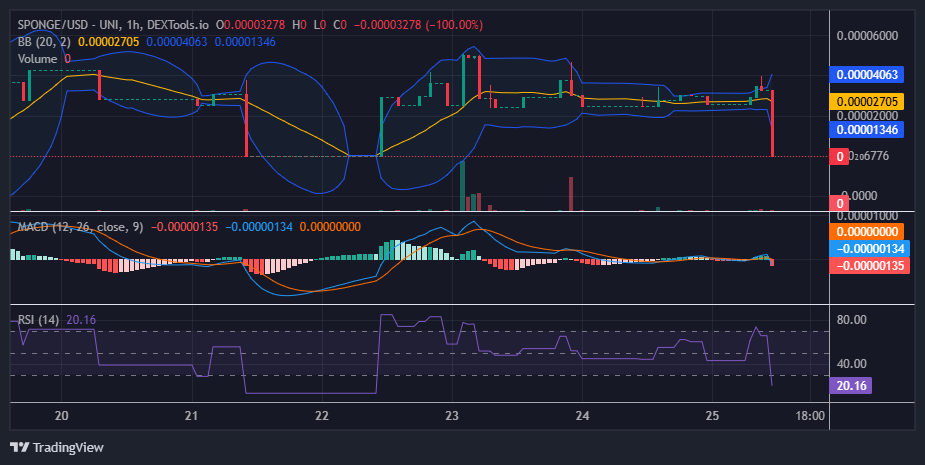
D2T (USD) Long-term Trend: Bullish (Daily Chart)

D2TUSD indicates an upward trend and might increase the overhead resistance as the crypto buy setup continues in its long-term view. It looks like the price will want to bounce up again.
Dash 2 Trade Price Predictions for Today, December 26: D2TUSD to Increase to the $0.01000 High Value
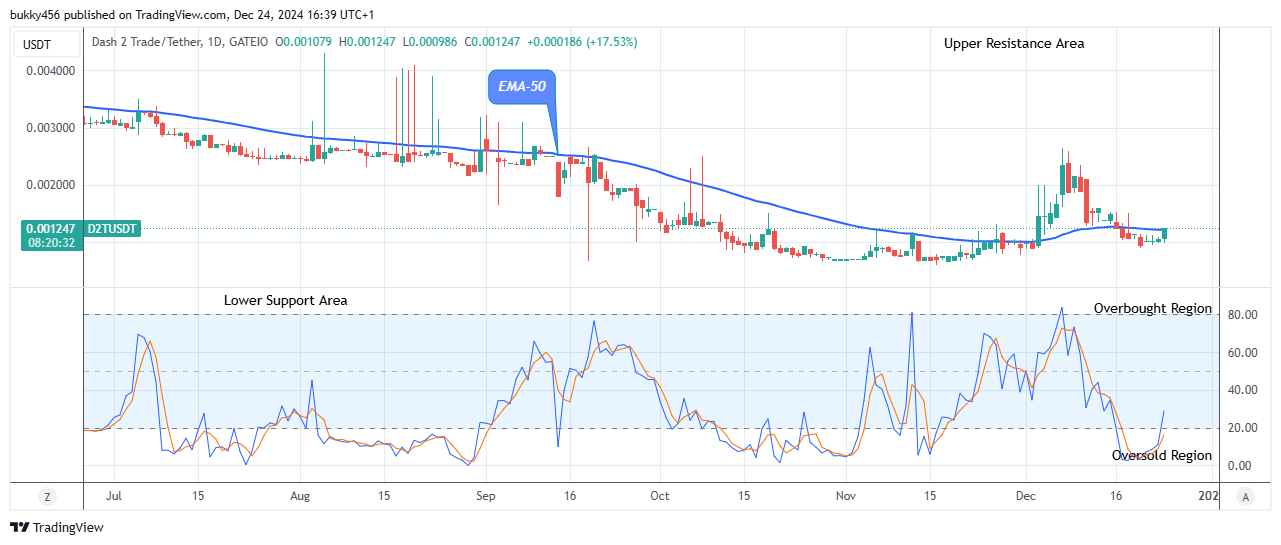
The coin is trading slightly above the moving averages, suggesting buyers are dominating and the token price will increase. However, the market is presently facing upper resistance at the recent high.

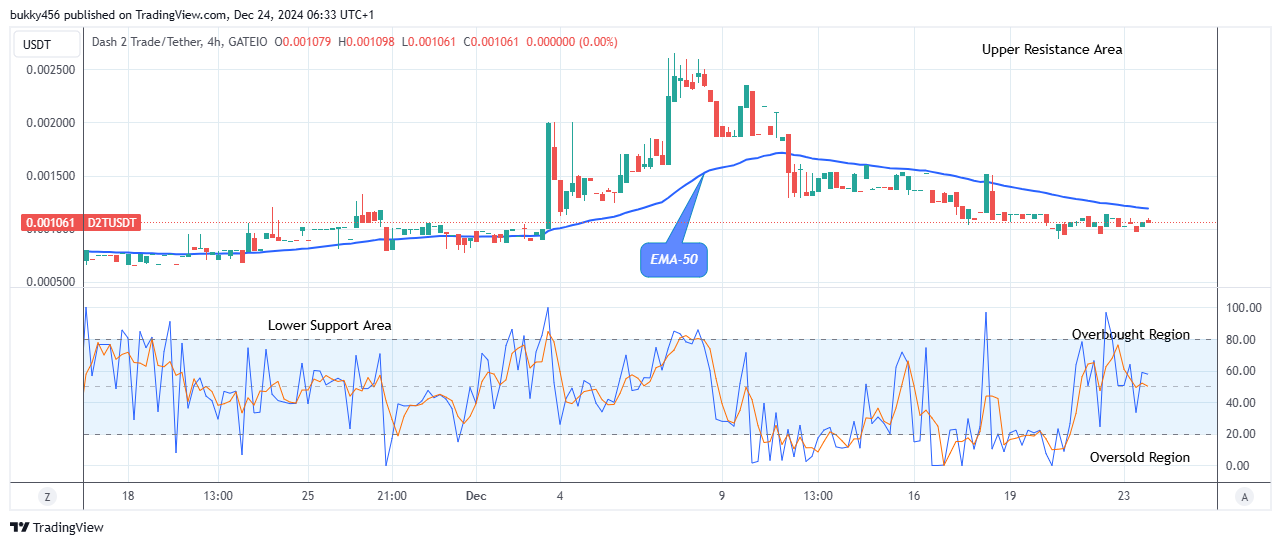
The sustained bullish pressure to the $0.00106 resistance level during the last session has made it easier for the coin to increase and remain strong above the supply levels in its recent high.

The current price of the D2TUSD pair at the $0.00124 resistance level above the EMA-50 as the daily session opens today indicates an uptrend in the context of the strength of the market, giving more room for a bullish impact in the market at the moment.

Therefore, if the bulls should increase their tension in the market, the price tendency will move above the key levels to hit the $0.00460 barrier level, signaling strong market optimism and potential for significant gains.

Additionally, the daily stochastic indicates an uptrend. Hence, there is a tendency for the Dash 2 Trade price to increase, if the support level at $0.000900 holds, this will enable buyers to increase the coin price to a high of $0.01000 soon in its long-term perspective.

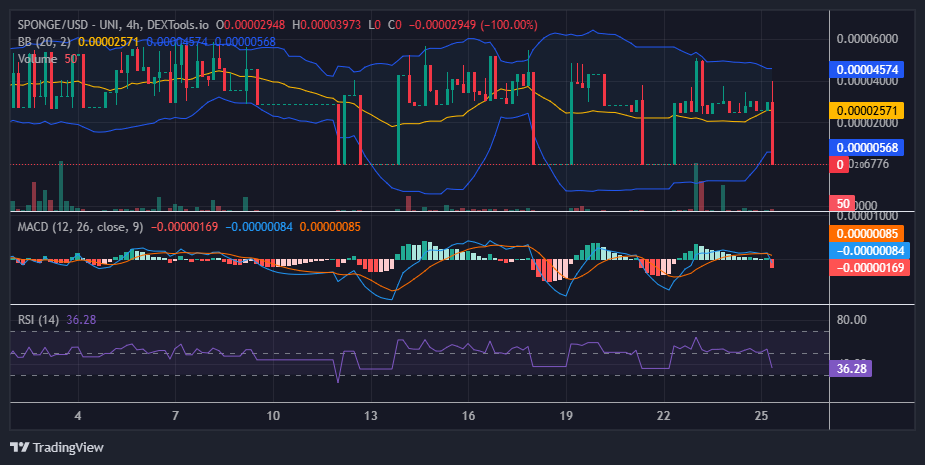
D2T (USD) Medium-term Trend: Bullish (4H)

Dash 2 Trade remains in a bullish trend and also looks good to buy in its medium-term outlook. Further, the price bar is above the supply level, confirming a bullish trend. The coin has been with the long traders to increase and maintain upward strength in its recent high.
Dash 2 Trade Price Predictions for Today, December 26: D2TUSD to Increase to the $0.01000 High Value
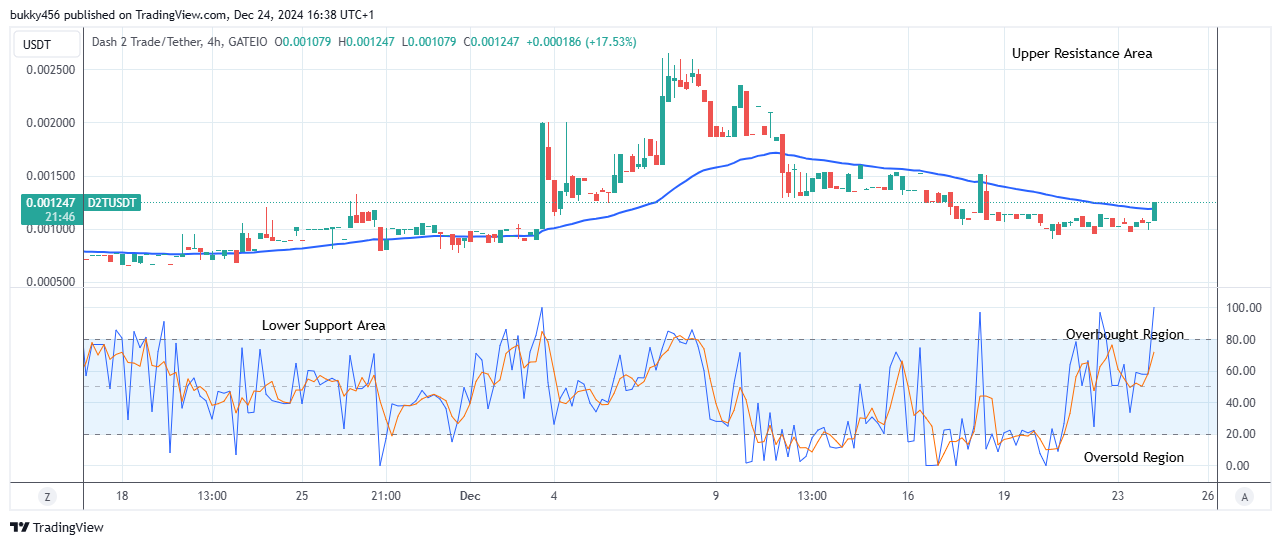
After a series of mixed trends, the D2TUSD price increases to a $0.00124 high value above the EMA-50 as the 4-hourly chart opens today, as it approaches the anticipated target.

Trading above the moving averages will enable the market value of D2TUSD to increase. Therefore, if the bulls could add more aggression to their activities, the $0.00265 resistance level might be tested soon.

Additionally, new buyers may emerge to increase the Dash 2 Trade price toward the higher side, leading the token price to the $0.01000 value in the upper resistance area in the days ahead in its medium-term perspective.

With Dash 2 Trade’s new offering, Bundles, you can purchase pre-curated token collections arranged by category straight from your preferred exchange in a few easy steps.

Want a coin that has a huge potential for massive returns? That coin is Dash 2 Trade. Buy D2T now.

$SPONGE (SPONGE/USD) Positioned for a Breakout: Key Levels to Watch

The digital asset $SPONGE (SPONGE/USD) is currently in a tense standoff between bullish and bearish forces. Despite persistent bearish pressure, the price has hovered around the $0.00003 level, demonstrating notable resilience. Recently, the bears managed to push the price down to $0.000025, but the bulls have fought back admirably, holding firm even as the market found a new low near $0.0000006. This unwavering defense of the critical $0.0000006 support level suggests that a significant price movement may be on the horizon. The bulls’ determination at this level highlights the potential for a breakout in the near term.

Key Market Dynamics:

  • Resistance Levels: $0.00005, $0.000055, $0.000060
  • Support Levels: $0.000020, $0.0000195, $0.000019

$SPONGE SPONGE/USD Positioned for a Breakout: Key Levels to Watch

$SPONGE (SPONGE/USD) Technical Outlook

The $SPONGE market’s repeated attempts to break through the $0.00005 resistance zone, only to face persistent rejection, may signal an impending decisive move. The convergence of the Bollinger Bands indicates a potential squeeze, often a precursor to significant price volatility in either direction. The current crypto signal suggests a possible breakdown toward the $0.0000006 level, which the bulls recently defended and recovered from. While this might hint at bearish dominance, the fact that the Bollinger Bands still maintain substantial bandwidth suggests the bears may struggle to establish a sustained downward trend.

$SPONGE SPONGE/USD Positioned for a Breakout: Key Levels to Watch

$SPONGE (SPONGE/USD) 1-Hour Chart Insights

The market has remained relatively steady around the $0.00003 price level, despite a notable bearish candlestick that highlighted a drop to $0.0000006—an area the market recently tested. The Relative Strength Index (RSI) indicates oversold conditions in the current trading session, suggesting the potential for a rebound in the near future.

Buy SPONGE/USD!

Join the SPONGE community and be part of the next big crypto sensation! Buy Sponge ($SPONGE) today!

Ripple vs. Solana: 2025 – A Battle of the Blockchains

In the dynamic world of cryptocurrency, Ripple and Solana stand out as major contenders. Ripple excels in cross-border payments, serving financial institutions, while Solana thrives with its rapid transaction speeds and growing dApp ecosystem.

This article compares their technical features, advancements, and future potential, helping you decide which blockchain offers greater promise in 2024. Whether you’re a crypto veteran or a newcomer, join us as we explore these two blockchain leaders.

Ripple vs. Solana: A Tale of Two Blockchains

The Contenders:

  • Ripple: A seasoned veteran in the blockchain space, Ripple focuses on bridging the gap between traditional finance and the digital world. Its core strength lies in facilitating rapid, cost-effective international transfers, making it a darling of banks and financial institutions.
  • Solana: The high-speed whippet of the blockchain world, Solana boasts lightning-fast transaction speeds and minimal fees, making it a fertile ground for the development of complex DeFi applications, NFTs, and high-frequency trading.

The Long-Term Vision:

Ripple: A Global Payment Powerhouse?

Ripple’s ambition is clear: to become the backbone of global financial transactions. Here’s why it might just succeed:

  • Cross-Border Domination: Ripple’s ability to expedite international transfers is its crown jewel. XRP, its native token, acts as a bridge currency, enabling near-instantaneous payments and reducing the need for pre-funded accounts. This efficiency has attracted major players in the financial sector, with partnerships blossoming with banks like Santander.
  • Regulatory Tailwinds: The ongoing legal battle with the SEC has cast a shadow, but a favorable outcome could unleash a wave of institutional investment in XRP within the US. Moreover, supportive crypto regulations emerging in regions like the EU and Asia could pave the way for broader adoption.
  • Beyond Payments: Ripple is not resting on its laurels. The XRP Ledger is evolving, fostering a vibrant ecosystem of DeFi, NFTs, and gaming applications. By nurturing innovation on its platform, Ripple aims to solidify XRP’s utility beyond traditional payments, expanding its appeal to a wider audience.
  • The CBDC Connection: As central banks worldwide explore the issuance of digital currencies, Ripple is strategically positioning itself as a key enabler. Its technology could facilitate inter-bank and cross-border CBDC transactions, further cementing its role in the evolving global financial landscape.

Solana’s Long-Term Potential

Solana’s architecture, optimized for high-speed and low-cost transactions, makes it a preferred platform for decentralized applications (dApps) in sectors like DeFi, GameFi, NFTs, and memecoins. Its unique combination of Proof of Stake (PoS) and Proof of History (PoH) ensures exceptional scalability, enabling high-frequency transactions crucial for demanding applications.

The rapidly growing Solana ecosystem, backed by strong developer and user adoption, has solidified its leadership in emerging sectors, attracting institutional investors. Continuous advancements, such as the Firedancer validator client developed with Jump Crypto, aim to boost throughput to 1 million transactions per second, reducing congestion and enhancing reliability.

Solana’s focus on high throughput and low fees distinguishes it from blockchains like Ethereum, though its higher hardware requirements raise decentralization concerns. However, its active community and strategic partnerships underscore its commitment to growth and innovation.

With ongoing improvements in developer tools, stability, and user experience, Solana is well-positioned to remain a key player in the decentralized ecosystem, particularly for applications prioritizing efficiency and cost-effectiveness.

Ripple: A Federated Approach

Ripple’s consensus mechanism, the Ripple Protocol Consensus Algorithm (RPCA), relies on a curated network of trusted validators. This “federated” approach, while prioritizing speed and efficiency for cross-border payments, raises concerns about decentralization. By delegating validation to a select group, Ripple prioritizes swift transaction confirmation over a fully distributed network. This model aligns with its focus on serving financial institutions, where speed and reliability are paramount.

Solana: Speed and Scalability Through Hybrid Consensus

Solana employs a unique hybrid approach, combining Proof of History (PoH) with Proof of Stake (PoS). PoH acts as a decentralized clock, enabling highly efficient transaction ordering. This, coupled with PoS for network security, allows Solana to achieve impressive transaction speeds and low latency. However, this performance-driven approach comes at a cost. The high computational demands of PoH require powerful hardware for validators, potentially limiting decentralization and increasing the risk of network instability under heavy load.

Ripple vs. Solana: 2024 - A Battle of the Blockchains
Source: create.vista.com

Adoption and Community Support

  • Ripple: Focused on institutional use, Ripple is widely adopted for cross-border payments, supported by partnerships with major banks and global events like XRPL Apex, which foster developer engagement.
  • Solana: Popular for dApps, DeFi, NFTs, and memecoins, Solana’s ecosystem grows through community initiatives like Solana Hacker House, which supports innovation among developers.

Ripple: Institutional Payment Powerhouse

Ripple excels in low-cost, instant cross-border payments, backed by partnerships with banks and payment providers like Santander and American Express. Its On-Demand Liquidity (ODL) solution and potential CBDC integrations further enhance its position as essential financial infrastructure for global finance.

Solana: Scalable Platform for Decentralized Apps

Solana’s architecture combines Proof of History (PoH) and Proof of Stake (PoS) for high-speed, low-cost transactions. Its developer-driven community fosters innovation through hackathons and summits, making Solana a top choice for dApps, DeFi, NFTs, and GameFi.

Which Is Better?

  • Choose Ripple if you’re focused on institutional finance and cross-border transactions.
  • Choose Solana for scalable, high-performance blockchain applications like DeFi, NFTs, and dApps. Your choice depends on your priorities: institutional integration versus decentralized innovation.

Trade crypto coins on Bybit

Zcash (ZEC/USD) Builds Momentum as $80 Comes Within Reach

The Zcash market is experiencing a resurgence, poised to retest or potentially rally toward its previous high of $80, a peak it reached in early December. The bullish momentum began in October but significantly accelerated in November. During this period, traders entered the market aggressively, causing a spike in volatility.

This surge in buying activity may have signaled to some traders that it was time to take profits, leading to a sell-off around the $80 level. The resulting bearish pressure from this profit-taking phase was considerable. However, the bulls managed to establish a higher support level at $50, highlighting their resilience and the market’s potential for further upward movement.

 Zcash Market Data

  • ZEC/USD Price Now: $74.54
  • ZEC/USD Market Cap: $1.23 billion
  • ZEC/USD Circulating Supply: 16.3 million
  • ZEC/USD Total Supply: 16.3 million
  • ZEC/USD CoinMarketCap Ranking: #83

Zcash (ZEC/USD) Builds Momentum as $80 Comes Within Reach

Key Levels

  • Resistance: $80.00, $85.00, and $90.00
  • Support: $50.00 $45.00, and $40.00

Zcash Market Through the Lens of Indicators

From the newly established support at the $50.00 level, the bulls, leveraging ongoing market volatility, staged a significant and dramatic rebound. This upward momentum has propelled the crypto signal toward the critical $80.00 level, where the previous bull run peaked. Given the presence of bearish bias at this resistance point, it is reasonable to anticipate challenges for the current bullish trend as it approaches $80.00.

Today’s trading session is represented by a Marubozu candlestick, signaling strong bullish dominance throughout the day. However, due to heightened volatility and the persistent bearish bias at $80.00, the market’s reaction upon reaching this level is crucial. It could either result in a reversal or a period of consolidation.

In the event of a reversal, the ongoing bullish momentum may enable the bulls to establish a higher support level. This higher support could strategically position the Zcash market for a continuation of the bullish trend.

Zcash (ZEC/USD) Builds Momentum as $80 Comes Within Reach

ZEC/USD Price Prediction: 4-Hour Chart Analysis

From the 4-hour chart, we initially observed price action consolidating around the $70.00 level as demand and supply remained balanced for some time. However, in the current trading session, a significant breakout occurred, with the market price diverging upward from the $70.00 level, signaling strong bullish momentum.

Despite this bullish movement, caution is warranted, as indicators suggest the market is entering overbought territory. This could indicate an impending correction. New traders are advised to wait for the formation of a higher low before entering the market, ensuring a more favorable and less risky entry point.

Trade crypto coins on Bybit

Bitcoin Price Prediction: BTC/USDT Recovers From a Sharp Retracement

Bitcoin Price Prediction (December 25):

Bitcoin previously dipped considerably from well above $100,000 to below the $95,000 price. This shook the crypto market as other coins also felt the impact, with most nosediving. However, this coin has changed course as its price action rebounded at the $95,000 price level.

BTC/USDT Long-Term Trend: Bearish (Daily Chart)

Key Price Levels:

Resistance: $100,000, $105,000, $110,000

Support: $95,000, $90,000, $85,000

Bitcoin Price Prediction: BTC/USDT Recovers From a Sharp Retracement

The BTC market has rebounded a bit downward off the resistance at the $95,000 price level. The mentioned resistance is almost at the same level as the 20-day Moving Average (MA) curve. The last price candle on this price chart is a red one but has a full body and, as such, keeps the market at a significant level above the 50-day MA line. Also, the Stochastic Relative Strength Index (RSI) lines are rising steadily despite the downward retracement of price action.

Bitcoin Price Prediction: BTC/USDT Has a Good Chance of Breaching the $95,000 Ceiling

The upside rebound of price action in the BTC daily chart seems to have biased the market to favor buyers. This is because price action has, as a result, closed in on the last MA lines up ahead. However, the ongoing session has introduced a bit of bearish retracement in the ongoing session. Also, traders will agree that the minor downward retracement is normal considering the sharp upside rebound in the previous session.

In addition, the Stochastic RSI lines are still rising upward without hinting at a bearish crossover. Consequently, market participants can very much anticipate a continued upside retracement through the 20-day MA lines that have constituted resistance to price action.

Bitcoin Price Prediction: BTC/USDT Bulls Look Vulnerable (4-Hour Chart)

Bitcoin’s price on the 4-hour chart has it that price action lies below most MA lines. However, the last price candle is a green one despite being below all the MA lines and its small size. The market, however, remains above the 20-day MA line. The Stochastic RSI lines are above the 80 threshold level and lie in the overbought region.

Bitcoin Price Prediction: BTC/USDT Recovers From a Sharp Retracement

Price activity in the BTC market still tends mostly towards a continued upward path. This can be seen as price action lurking just below the 200-day MA while at a significant distance above the 20-day MA lines. Meanwhile, the Stochastic RSI lines are in the overbought region while they maintain a slight upward trajectory. The last price candle there is also green despite appearing very small-sized. Therefore, traders may aim at the 98,000 or even the $100,000 threshold.

Get Bitcoin here. Buy BTC 

Zksync (ZK/USDT) Poised for a Potential Upside Recovery

The market for Zksync against the Tether has recently exhibited a mixed sentiment, reflecting a period of consolidation after a sharp decline from a recent all-time high at $0.2300.

Over the weeks, the price has been characterized by increased volatility, with an attempt at recovery after a minor dip within the $0.2000 level.

However, current price movement around the Guppy Multiple Moving Averages (GMMAs) suggests caution as the pair eyes potential recovery toward previous highs.

Currently, Zksync is trading at $0.2044 with over 18 million traded volumes for the day.

Zksync (ZK/USDT) Poised for a Potential Upside Recovery
ZKUSDT-Daily Chart

Technical Indicators

Major Resistance Levels: $0.2100, $0.2200, and $0.2300

Major Support Levels: $0.2000, $0.1940, and $0.1840

Zksync Technical Analysis

The analysis of Zksync against the Tether on a daily chart shows that the pair is consolidating within a tight range around the short EMAs, suggesting indecision among traders.

The compressed GMMA lines indicate reduced volatility. However, the price action around the lower part of the short EMAs hints at bearish pressure. Therefore, a clear crossover of sets of EMAs and price movement towards $0.2100 would signify a trend reversal.

On the other hand, the Stochastic RSI signals a neutral position for the pair with signs of an upside improvement. At this point, a break to the upside is possible with a spike in trading volume, with an improvement of the Stochastic lines above the 60-mark level; otherwise, the opposite holds.

ZK/USDT Analysis: What’s Next?

On the 4-hour timeframe, the analysis of ZK/USDT shows that the price is showing slight upward momentum after a period of consolidation with a little bullish uptick above the GMMAs. This indicates a short-term bullish strength.

On one side, the set of EMAs suggests an upward slope, reinforcing the possibility of a sustained upside movement as the lines begin to spread upward.

On the other hand, the Stochastic oscillator indicator suggests that buying activities may be overextended in the short term.

Therefore, with an increased trading volume, a breakout above $0.2050 may lead to a test of higher resistance. However, if the overbought signal triggers a pullback, the support of around $0.2000 will be a critical level to watch.

Zksync (ZK/USDT) Poised for a Potential Upside Recovery
ZKUSDT-4H Chart


You can purchase crypto coins here. Buy LBlock

Decentraland (MANA/USD) Anticipates the Resumption of its Bullish Trend

Price Analysis: MANAUSD Experiences a Bullish Resurgence, With the Price Poised for Further Upward Movement

MANA/USD has recently demonstrated a significant shift in the market, marked by a notable bullish break of structure. This critical development unfolded in November 2024 when the price surpassed the major high established in early June 2024. This breakout signified a pivotal moment for MANAUSD, confirming a bullish trend and setting the stage for continued upward momentum.

MANA/USD Key Levels

Demand Levels: $0.3980, $0.2590
Supply Levels: $0.5320, $0.6870

Decentraland (MANA/USD) Anticipates the Resumption of its Bullish Trend

Following the bullish break of structure, MANAUSD exhibited further strength as it breached the $0.6870 supply level. However, resistance emerged at the $0.8510 supply level, temporarily halting the bullish momentum. The strong rejection at $0.8510 initiated a bearish retracement, driving the price below the daily Moving Average, which signaled a bearish trend.

During this bearish phase, the price revisited and recovered critical supply levels, namely $0.6870 and $0.5320. Despite these corrections, the broader market sentiment remains bullish. The price action at the daily bullish order block underscored this sentiment, as the order block’s activation triggered a strong bullish reaction. This was evidenced by a substantial wick rejecting the order block, signaling robust buying pressure.

Zooming into the 4-hour timeframe, additional insights emerge. Following the activation of the bullish order block, the price experienced a short-term bullish break of structure, indicating a potential resumption of the broader bullish trend. The confluence provided by the 4-hour Moving Average, where the price remains above the indicator, further supports the bullish outlook.

Decentraland (MANA/USD) Anticipates the Resumption of its Bullish Trend

Market Expectation

The current bullish trend suggests the potential for MANAUSD to reclaim and surpass critical price levels, including $0.5320, $0.6870, and ultimately the $0.8510 resistance. The market structure and momentum indicate a resumption of the underlying bullish trend, positioning MANAUSD for further gains in the coming sessions.

You can purchase Lucky Block here.  Buy LBLOCK

Note: Cryptosignals.org is not a financial advisor. Do your research before investing your funds in any financial asset or presented product or event. We are not responsible for your investing results

Avalanche (AVAX/USD) Market Shows Signs of Bullish Continuation Short-Term

Avalanche Price Prediction – December 24

AVAXUSD market shows signs of bullish continuation short-term. The price has retracted upward after hitting the bullish order block.

The AVAXUSD daily chart utilizes key indicators like the 9-day Simple Moving Average (SMA) and the Stochastic Oscillator. The price currently trades near $40.230, slightly below the SMA at $41.280, indicating a potential resistance. However, the Stochastic Oscillator shows bullish momentum, with the %K line crossing above the %D line at oversold levels, suggesting that buyers may drive prices higher in the near term.

AVAX/USD Market Key Levels

Resistance: $55.860, $65.380, $81.870
Support: $33.020, $17.280, $8.620

AVAX/USD – Daily Chart

The daily chart for AVAXUSD shows that the market is consolidating between two major critical zones.

AVAXUSD has bounced off a significant support zone around $33.020–$35.000. This area aligns with an order block (+OB) and represents a reversal point for the recent bearish move.

The market structure shows an earlier bearish shift (MSS), but the recent higher low formed near $37.630 suggests a potential reversal to the upside. The next resistance lies near the $50.000 order block (OB), which aligns with previous supply levels.

Avalanche (AVAX/USD) Market Shows Signs of Bullish Continuation Short-Term

What is the projection for AVAXUSD market?

Given the bullish momentum and recovery from the $33.020–$35.000 support zone, AVAXUSD is likely to continue upward toward the $50.000–$55.860 range in the short term. A break above $41.280 (SMA) could accelerate the move.

However, failure to sustain momentum may see the price retesting the $35.000 area before another upward attempt. For now, the short-term outlook remains bullish.

Avalanche (AVAX/USD) Market Shows Signs of Bullish Continuation Short-Term

AVAX/BTC Price Analysis

The AVAXBTC pair shows bullish momentum, supported by a failed swing low near the 0.0003420–0.0003330 order block (+OB). The price has rebounded strongly and is trading at 0.0004150, above the critical support zone, with the 9-day SMA at 0.0004160 acting as immediate resistance.

The Stochastic Oscillator indicates bullish momentum, as the %K line has crossed above the %D line from oversold levels. A continued move above 0.0004170 could push the price toward the next resistance at 0.0004790 in the short term.

Avalanche (AVAX) Current Statistics
The current price: $40.230
Market Capitalisation: $16,730,000,000
Trading Volume: $779,490,000

Place winning AVAX/USD trades with us. Get AVAX here

Dash 2 Trade Price Prediction for Today, December 25: D2TUSD Price Could See an Uptrend Soon

Dash 2 Trade Price Forecast: D2TUSD Price Could See an Uptrend Soon (December 25)

The D2TUSD market could see an uptrend soon as the selling pressure is about to end and a swift increase will follow. The crypto is about completing the downward movement and is on the verge of a correction phase. Thus, should the bulls add more pressure to the buying momentum on the crypto, the coin price may reverse to the bullish pattern, and its upside moves could extend to a $0.01000 upper resistance level, indicating a high potential for the coin investors.

Key Levels:
Resistance levels: $0.00108, $0.00109, $0.00110
Support levels: $0.000700, $0.000600, $0.000500

D2T (USD) Long-term Trend: Bearish (Daily Chart)

Dash 2 Trade has a bearish posture and it’s on the verge of an upside reversal. The coin price could see an uptrend soon as the selling pressure reaches an exhaustion stage. The price is below the EMA-50, indicating a downward momentum and the high impact of sellers in the market.
Dash 2 Trade Price Prediction for Today, December 25: D2TUSD Price Could See an Uptrend Soon
The sell traders made a downward move to the $0.000900 support level in the last session, giving sellers more strength to continue with the trend in its recent low. Hence, the crypto market is now oversold and is on the verge of an upside reversal.

The D2TUSD price dropped further today, reaching a low of $0.00106 below the supply levels as a result of the sell traders’ actions.

Meanwhile, buyers could take advantage of this chance to purchase the Dash 2 Trade at a discount to make a bigger profit later on.

However, if a renewed surge in buyers’ interest occurs, the D2TUSD price could see an uptrend and undergo an upside reversal at the $0.00106 low level to retest the prior high of $0.00460 level, providing coin purchasers with great recovery potential,

In conclusion, the Dash 2 Trade pair is on the verge of an upside reversal as the market remains in an uptrend at the oversold region of the daily stochastic, implying that the selling pressure is likely to end soon and will compel buyers to resume sooner.

Hence, the token could see an uptrend and may extend to the $0.01000 high mark sooner in its long-term perspective.

D2T (USD) Medium-term Trend: Bearish (4H Chart)

Here on the medium-term chart, D2TUSD shows a downward movement and remains on the verge of an upside reversal. This is clear as the price continues to make lower highs and lower lows.
Dash 2 Trade Price Prediction for Today, December 25: D2TUSD Price Could See an Uptrend Soon
The market price of Dash 2 Trade drops further to a $0.00106 low mark below the moving averages as the 4-hourly session opens today due to low bullish momentum. Meanwhile, traders who buy the crypto during a bearish market will also make gains in the future.

In addition, the price of the D2TUSD could see an uptrend if the bulls change their orientation and increase their buying motives.

The pair may reverse from the $0.00106 low point swing to a $0.00265 high level and extend further to reach the $0.01000 upper resistance level in the days ahead in its medium-term forecast.

The best social trading and cryptocurrency analytics tool is Dash 2 Trade, which is made to assist you in making quicker, more informed, and more lucrative decisions in the cryptocurrency market.

Want a coin that has a huge potential for massive returns? That coin is Dash 2 Trade. Buy D2T now.