Cardano (ADA/USDT) Witnesses a Sharp Price Dip

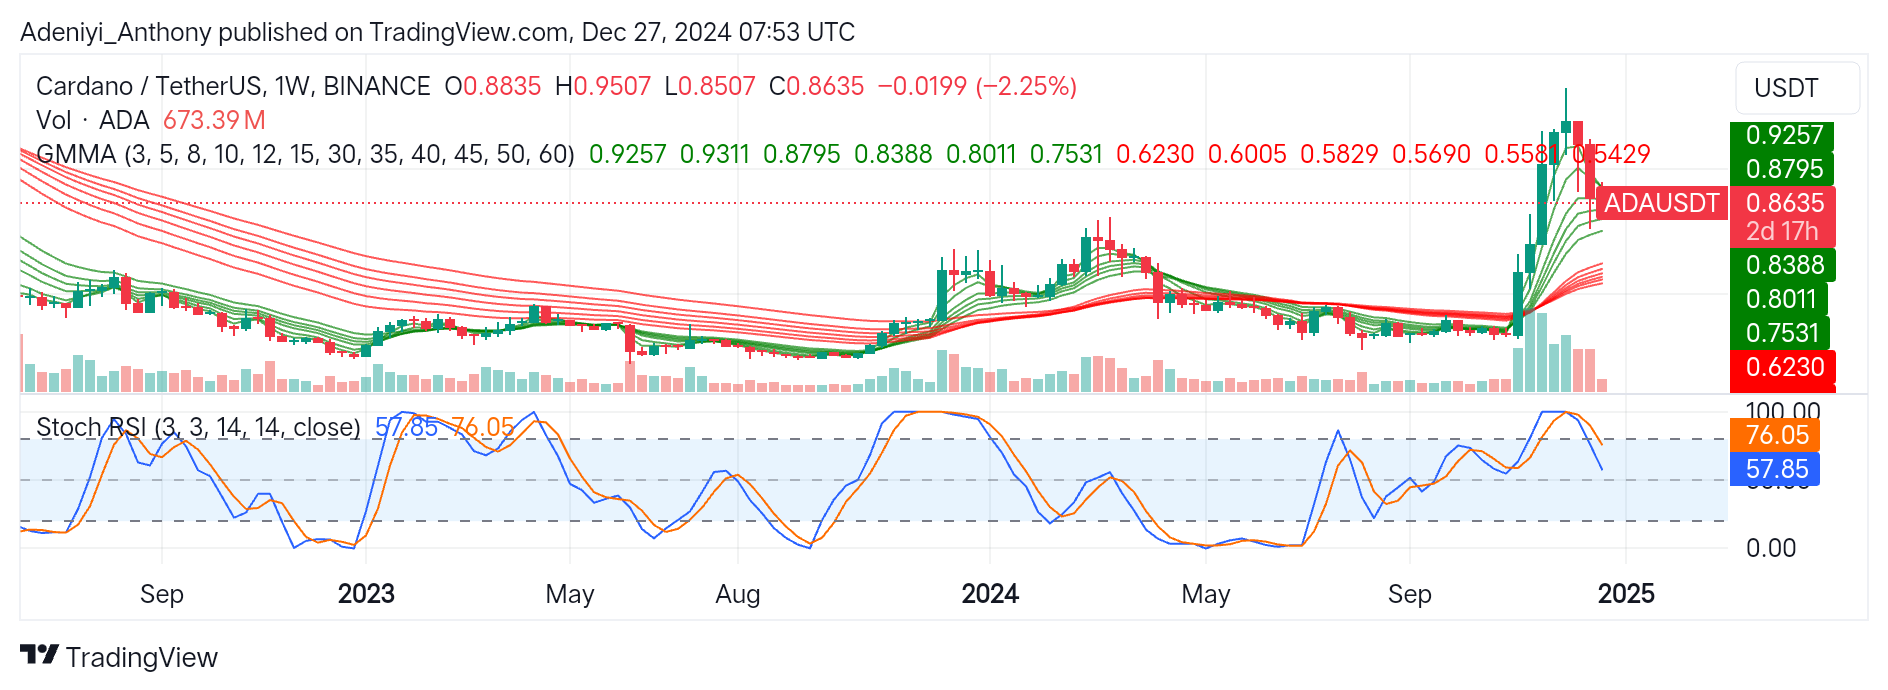
Cardano Long-term Analysis: Bullish

Cardano against the Tether, though cautiously optimistic, has been seeing a strong decline after a recent major uptrend.

In recent weeks, the pair has shown an impressive upward movement, breaking above major resistance levels before encountering selling pressure above the $1.000 level.

However, ADA’s current trend indicates a retracement phase, which can be attributed to the broader take-profit experience in the crypto market. To this end, the current price movement between $0.795 and $0.8388 will determine Cardano’s next move.

Currently, ADA/USDT is trading at $0.8635, moving 2.25% below the previous bearish candlestick.

Cardano (ADA/USDT) Witnesses a Sharp Price Dip
ADAUSDT-Weekly Chart

Technical Indicators

Major Resistance Levels: $0.8795, $0.9257, and $0.9507

Major Support Levels: $0.8388, $0.8011, and $0.7531

Cardano Technical Analysis

The analysis of Cardano against the Tether shows that ADA/USDT is currently experiencing a sharp decline after a major move to sustain above the $1.000 level.

Despite the current market situation, the Guppy Multiple Moving Averages (GMMAs) show that the pair’s bullish momentum in the long run is still intact. Therefore, a reversal will likely occur if ADA finds strong support at $0.8388 with an aggressive increase in trading volumes; otherwise, a break below $0.8011 would indicate movement toward $0.7531.

On the other hand, the Stochastic RSI is showing a bearish crossover from an overbought region, with the lines pointing downwards. This signals potential short-term weakness as the indicator remains above the 50-mark level. However, a pullback or continuation of the previous uptrend is possible if the lines sustain above the midline.

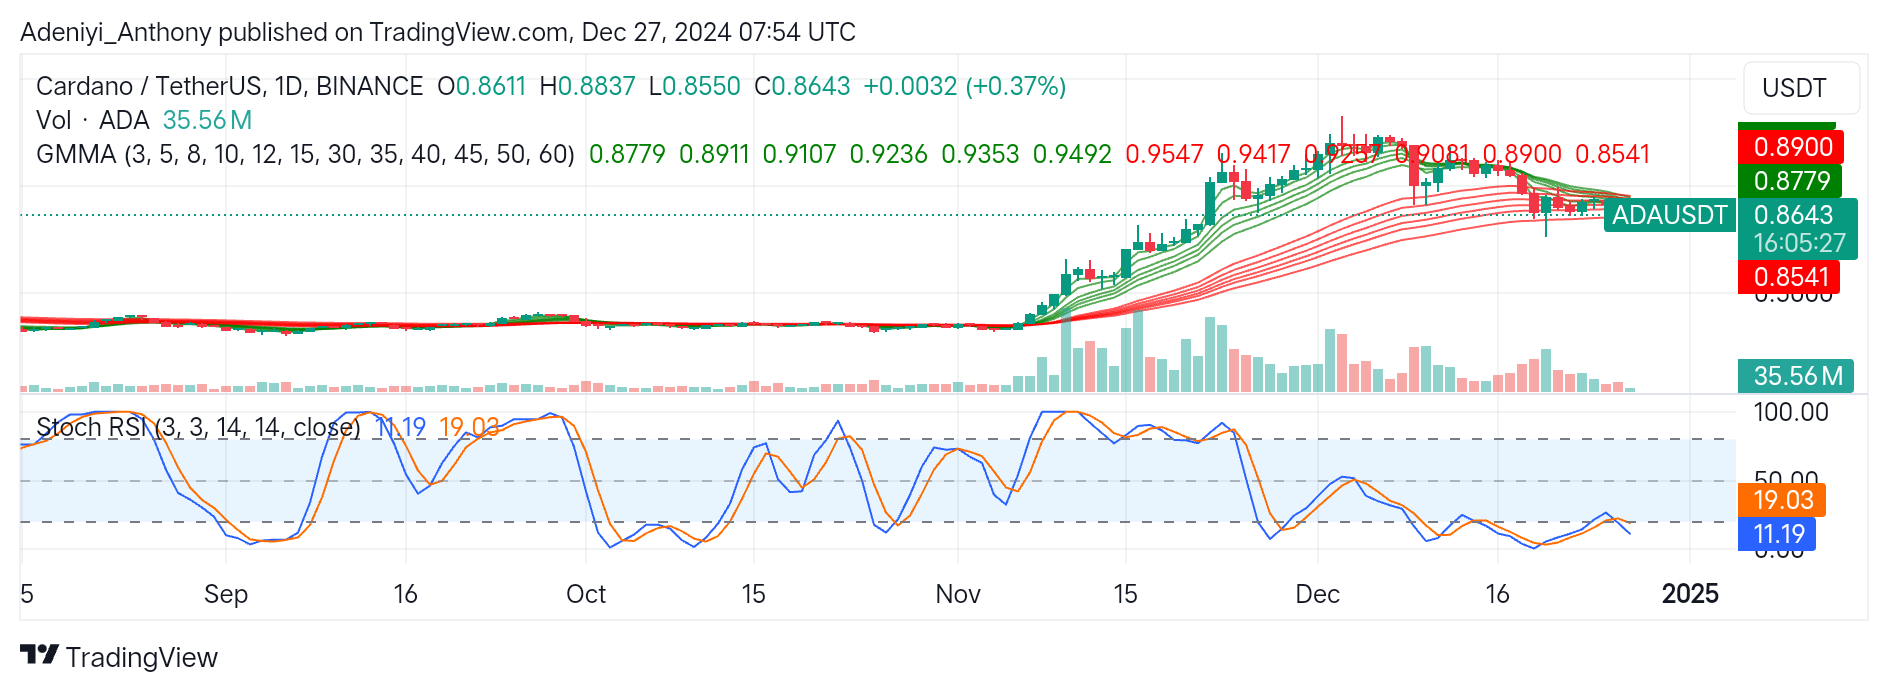
ADA/USDT Analysis: What’s Next?

The analysis of ADA/USDT on a daily timeframe shows that the pair is experiencing a steady decline, with prices heading southwards as seen on the chart below. The GMMAs appear to be converging, possibly indicating a consolidation as the price dips below the $0.9000 level.

On the contrary, the Stochastic oscillator signals an oversold condition with over 35 million participants for the day, suggesting a potential bounce might be on the horizon.

ADA/USDT may continue a range-bound movement between $0.8779 and $0.8541. A break above or below these points would signal a clear direction for the pair.

Cardano (ADA/USDT) Witnesses a Sharp Price Dip
ADAUSDT-Daily Chart


You can purchase crypto coins here. Buy LBlock

Solana Price Prediction: SOL/USDT Stays Under Pressure Just Above $185

Solana Price Prediction (December 27):

Ever since price action tapped out at the $260 resistance level, the Solana market has been making lower lows. The market has just rebounded off a low at the $180 price level. Let’s take a closer look at where the market may head shortly.

SOL/USDT Long-Term Trend: Bearish (Daily Chart)

Key Price Levels:

Resistance: $200, $220, $240

Support: $190, $180, $170

Solana Price Prediction: SOL/USDT Stays Under Pressure Just Above $18

The Solana market had rebounded off the $200 resistance strongly in the previous session. Meanwhile, the ongoing session has rebounded upward through the 100-day Moving Average (MA) line. As a result, price action stays above the two-month-old support at the $185 price level. Meanwhile, the Stochastic Relative Strength Index (RSI) lines can be seen to have converged just at the 50 level of the indicator.

Solana Price Prediction: SOL/USDT Minute Gains Seem Vulnerable

From the daily Solana price chart, it could be perceived that price action has seen a minimal upside retracement. However, this upside retracement seems so small that it can still be overpowered by the more dominant market sentiment. The last price candle on the chart has only placed the token’s price just above the 100-day MA lines.

Meanwhile, the Stochastic RSI lines have just delivered a crossover at the 50 mark of the indicator. The direction of the ensuing lines is still unclear, and the appearance of the last price candle on the chart seems to complicate the matter. However, since price action seems to be making some progress lately, traders can anticipate some more positive retracement here.

Solana Price Prediction: SOL/USDT Market Persistently Clinches Minimal Gains (4-Hour Chart)

Even in the Solana 4-hour market, bulls continue to record minimal gains. Here, the last two prices have appeared green. The latest price candle appears higher than the previous one. At the same time, the Stochastic RSI lines are rising steadily from the indicator’s oversold zone. However, price action appears below all the MA curves on the chart.

Solana Price Prediction: SOL/USDT Stays Under Pressure Just Above $18

Given the indications on the 4-hour price chart, headwinds seem to have a threatening look given the oversold condition and the position of price action. With price action below all the MA lines, it appears that price activity remains under pressure. However, the upward trajectory of the RSI lines suggests that this market has a short-term upward trajectory, at least towards the $200 mark.

Get Solana here. Buy SOL 

KULR Technology Takes Up Bitcoin as New Investment Plan

KULR Technology Group, a specialist in energy and battery solutions for sectors like aerospace, defense, and space exploration, has made a sizable investment in Bitcoin.

On average, this purchase required $96,556.53 per BTC; to this end, the corporation has spent about $21 million to acquire 217.18 units of the digital asset.

KULR Technology Takes Up Bitcoin as New Investment Plan

Tracking KULR’s Bitcoin Investment

On December 4, KULR announced its bold plan to invest up to 90% of its excess funds in Bitcoin. With additional expenditures planned in the future, the $21 million purchase represents the first phase of this strategy.

To ensure safety, KULR has partnered with Coinbase Prime to guarantee the safety of its BTC. A platform whose services include transaction administration, safe storage, and support for the USDC, or digital dollar.

By incorporating Bitcoin into its treasury strategy, the firm hopes to spur growth by fusing state-of-the-art technology with creative financial management.

KULR’s Financial Compliance and Broader Implications

Aside from the firm’s Bitcoin purchase, the firm recently resolved a compliance issue with the NYSE American Stock Exchange. This reflects a positive development for its overall business stability. However, the company’s decision to invest in Bitcoin is in line with a growing trend of companies adding Bitcoin to their balance sheets, with notable examples including MicroStrategy, a leader in Bitcoin adoption among corporations.

To this end, these actions demonstrate a growing confidence in Bitcoin’s potential despite its price fluctuations. Currently, Bitcoin is trading around $95,285, just 3% below in the last day trading session. Moreover, trading experts like trader Peter Brandt remain optimistic, predicting that Bitcoin will rise to $108,358 soon.

KULR Technology Takes Up Bitcoin as New Investment Plan

However, by adding Bitcoin to its financial plan, the firm is taking a bold but progressive stance by joining knowledge of energy solutions with cutting-edge financial techniques to create a bright future.


In order to place winning trades with us via Bybit, you can open an account here.

$SPONGE (SPONGE/USD) Surges Ahead but Faces Key Resistance at $0.00004

The ongoing tug-of-war between SPONGE/USD buyers and sellers persists, with the bulls showing signs of gaining an advantage as observed in the previous analysis. Today’s market outlook reveals renewed bullish momentum, with prices rebounding and approaching the critical $0.00004 level. Despite the bears asserting their presence at this resistance level, the bulls are demonstrating resilience, increasing the likelihood of a potential breakout.

Key Market Dynamics:

  • Resistance Levels: $0.00005, $0.000055, $0.000060
  • Support Levels: $0.000020, $0.0000195, $0.000019

$SPONGE (SPONGE/USD) Surges Ahead but Faces Key Resistance at $0.00004

$SPONGE (SPONGE/USD) Technical Outlook

The recent standoff between SPONGE/USD buyers and sellers at the $0.00005 price level, which resulted in a breakdown, appears to have strengthened bearish momentum, driving prices further downward. However, buyers have established strong support at the $0.0000006 level, while sellers maintain resistance at $0.0000004, contributing to a stabilizing market. This is further supported by the convergence of the Bollinger Bands, indicating reduced volatility and signaling the potential for a significant market movement.

Additionally, the Moving Average Convergence and Divergence (MACD) indicator has formed a bullish crossover below the zero line, suggesting a recovery in bullish sentiment. A critical test for this recovery will be the ability to break and sustain momentum above the $0.00004 resistance level, which could define the market’s next directional move.

$SPONGE (SPONGE/USD) Surges Ahead but Faces Key Resistance at $0.00004
$SPONGE 1-Hour Chart Insights

A closer look at the 1-hour chart reveals that $SPONGE is displaying significant volatility, resembling a rollercoaster pattern. The Relative Strength Index (RSI) highlights this fluctuation, with its line oscillating between the overbought and oversold regions, reflecting the market’s heightened volatility. The Bollinger Bands further confirm this dynamic, showing notable price activity within their range.

Additionally, the 20-day moving average indicates signs of a bullish recovery, as the moving average begins trending upward, signaling strengthening momentum in favor of the bulls.

Buy $SPONGE!

Join the SPONGE community and be part of the next big crypto sensation! Buy Sponge ($SPONGE) today!

ApeCoin (APEUSD) Undergoes a Bearish Reversal

Price Analysis: APEUSD Shifts from Bullish Momentum to Bearish as Sellers Take Control of the Market

APEUSD has recently entered a bearish phase following the breach of its prevailing bullish trendline. Before this shift, the market experienced significant bullish price movements as prices formed a bullish trend line.

APEUSD Key Levels

Demand Levels: $1.020, $0.480
Supply Levels:$1.490, $2.180

ApeCoin (APEUSD) Undergoes a Bearish Reversal

Initially, APEUSD exhibited a bearish trend as the price declined from $1.490 to a significant low of $0.480. Upon reaching the $0.480 support level, the market entered a period of consolidation lasting from July 2024 through mid-October 2024. This consolidation was eventually disrupted by a strong bullish breakout that drove the price past the critical $1.490 supply zone.

Following this breakout, APEUSD sustained its bullish momentum, experiencing another rally that eventually pushed the price to a peak of $2.180. However, this upward movement encountered resistance at the $2.180 supply zone, resulting in a retracement. Although the price attempted to resume its bullish trajectory, the pullback breached the established bullish trendline, signaling a reversal in market sentiment. Consequently, bearish pressure resumed, driving the price downward.

During the 4-hour timeframe, APEUSD has reached the $1.020 demand level, which is currently showing signs of a potential bullish buildup. A failed low pattern has emerged at this level, suggesting buyers attempt to regain control.

ApeCoin (APEUSD) Undergoes a Bearish Reversal

Market Expectation

The developing bullish momentum faces a significant hurdle at the daily order block, which is likely to act as a strong resistance zone. As the daily Relative Strength Index still reflects a Bearish signal, this area is anticipated to serve as a critical turning point, potentially reinforcing bearish price action and resuming the downtrend.

You can purchase Lucky Block here.  Buy LBLOCK

Note: Cryptosignals.org is not a financial advisor. Do your research before investing your funds in any financial asset or presented product or event. We are not responsible for your investing results

UNUS SED LEO (LEO/USD) Market Prepares For Bullish Continuation After Breakout

UNUS SED LEO Price Prediction – December 25

LEOUSD market prepares for bullish continuation after the breakout. The price is currently consolidating as LEOUSD accumulates for another breakout.

The LEOUSD daily chart shows that the price is trading slightly above the 9-day Simple Moving Average (SMA) at $9.340, indicating a neutral-to-bullish stance during consolidation. The Stochastic Oscillator, with the %K line at 62.03 and the %D line at 56.53, remains in bullish territory but shows a slight slowdown, suggesting that a breakout is likely after consolidation concludes.

LEO/USD Market Key Levels:

Resistance levels: $9.000, $9.620, $10.710
Support levels: $7.940, $6.500, $5.390

LEO/USD – Daily Chart

The daily chart for LEO/USD shows that the market is in a consolidation phase.

Price action indicates a consolidation phase between $9.000 and $9.620, following a strong rally from earlier support at $7.950. The current range forms a healthy accumulation zone, with multiple tests of the $9.620 resistance level signaling potential bullish breakout pressure. A clear character change (CHoCH) at $9.000 earlier confirmed the bullish trend.

UNUS SED LEO (LEO/USD) Market Prepares For Bullish Continuation After Breakout

What is the projection for the LEOUSD market?

Once the consolidation phase ends, LEOUSD is projected to break above the $9.620 resistance and move toward $10.710, the next significant resistance level. Failure to break higher may result in a retest of the $9.000 support zone, but the broader trend remains bullish, favoring upward movement in the short-to-medium term.

UNUS SED LEO (LEO/USD) Market Prepares For Bullish Continuation After Breakout

LEO/BTC Price Analysis

LEOBTC is in a retracement phase, testing support near 0.00009470. A bounce from this level could lead to a bullish continuation toward 0.00010500.

If support fails, the price may revisit lower levels near 0.00008810. The bullish trend is likely to resume after breaking the descending trendline resistance.

UNUS SEO LEO (LEO) Current Statistics
The current price: $9.4220
Market Capitalization: $8,720,000,000
Trading Volume: $1,560,000

Place winning LEO trades with us. Get LEO here

Basic Attention Token (BAT/USD) Surges Back Above the $0.25 Benchmark

After a bearish trend was triggered at the high of $0.35, causing descending price peaks, the bulls of Basic Attention Token (BAT) began stepping in at the $0.20 price level. Since finding pivotal support at $0.20, there has been a significant bullish recovery. The bulls successfully broke the first descending resistance level on their path to recovery, with the price surging above the critical $0.25 level, previously dominated by bearish pressure.

Now that the market has risen significantly above this threshold, peaking near the $0.30 level, the subsequent bearish correction from $0.30 was cut short at $0.25 as bullish momentum consolidated around this level. This demonstrates the growing strength of the bulls.

Basic Attention Token Market Data

  • BAT/USD Price Now: $0.2547
  • BAT/USD Market Cap: $374.3 million
  • BAT/USD Circulating Supply: 1.5 billion
  • BAT/USD Total Supply: 1.5 billion
  • BAT/USD CoinMarketCap Ranking: #180

Basic Attention Token (BAT/USD) Surges Back Above the $0.25 Benchmark

Key Levels

  • Resistance: $0.30, $0.35, and $0.40
  • Support: $0.25, $0.20, and $0.15.

Price Analysis for Basic Attention Token: The Indicators’ Point of View

The Bollinger Bands indicate substantial bandwidth, reflecting a high level of market volatility. Despite this, the bulls have demonstrated resilience by defending the $0.25 price level, preventing the bearish trend from fully eroding the gains made during the previous bullish run.

In today’s daily trading session, the candlestick pattern provides further insight into Basic Attention Token market dynamics. A hammer candlestick has formed, often indicative of brewing bullish momentum. This pattern suggests ongoing bullish activity or bias around the $0.25 price level.

If bearish pressure persists, the price action could transition into a consolidation phase, as the bulls at this level continue to exhibit strength. This scenario in the crypto signal underscores the potential for stability around the $0.25 level as both sides vie for control.

Basic Attention Token (BAT/USD) Surges Back Above the $0.25 Benchmark

BAT/USD 4-Hour Chart Outlook

Zooming into the 4-hour chart, the buyers’ position at the $0.25 price level appears strong, suggesting a potential bounce from this critical support. This optimism stems from the bulls’ ability to defend and rebound at progressively higher levels, demonstrating their growing strength.

However, analyzing the market from another perspective reveals a convergence of bullish and bearish forces at the $0.25 level. Additionally, the consistent decline in the trade volume histogram height suggests that the market may be entering a period of volatility compression. Such a “volatility squeeze” often precedes a significant price movement, which is likely to result in a bounce, rally, or upward market performance.

Trade crypto coins on Bybit!

Ethereum (ETH/USD) Hints at Potential Recovery Amid Growing Market Caution

Ethereum Long-term Analysis: Bullish

The market for Ethereum against the United States dollar has witnessed volatility in previous trading sessions, evidenced in its bullish trajectory towards $4,000 before this time.

Ethereum has surged significantly in the previous weeks, reflecting renewed investors’ confidence and growing market demand. However, despite the optimism, the growing overbought signs, highlighted by the Stochastic RSI, suggest a potential price correction might be on the horizon. To this end, the price of Ethereum may dip towards $2,910.43 with increased selling pressure in the short term.

Currently, ETH/USD is trading at $3,364.04, with over 86 thousand traded volumes.

Ethereum (ETH/USD) Hints at Potential Recovery Amid Growing Market Caution
ETHUSD-Weekly Chart

Technical Indicators

Major Resistance Levels: $3,545.21, $3,972.81, and $4,500.00

Major Support Levels: $2,910.43, $2,500.00, and $1,848.04

Ethereum Technical Analysis

The analysis of Ethereum against the USD weekly timeframe shows that the pair is currently exhibiting a sign of renewed hope with the formation of a small bullish tick. However, the price actions between the upper segment of the Bollinger Bands suggest the pair may be overbought as the price faces a $3,545.21 resistance level.

On the other hand, the Stochastic RSI suggests a potential downside correction as the oscillator’s lines point to the south. To this end, as ETH/USD eyes the $4,000, the $2,910.34 may be a critical turning point as indicators signal overbought conditions.

ETH/USD Analysis: A Recovery or Corrective Move?

ETH/USD on a daily timeframe appears to operate between the lower segment of the Bollinger bands. However, the bands hint at the possibility of due to its expansion.

On the other hand, the Stochastic RSI suggests an oversold condition as both lines read extremely low figures. This may indicate a potential rebound, but a confirmed bullish crossover is needed for an upside recovery.

To this end, a break below $3,187.45 would hint at further downside correction; otherwise, a break above $3,511.54 may signal recovery to the North.

Ethereum (ETH/USD) Hints at Potential Recovery Amid Growing Market Caution
ETHUSD-Daily Chart


You can purchase crypto coins here. Buy LBlock

Uniswap Price Prediction: UNI/USDT Eyes the $12.00 Support

Uniswap Price Prediction (December 26):

Since price action broke below the $18.00 price level, it has been retracing to lower levels. This is evident as price action continues to make lower lows. More recently, the market has been falling moderately downward.

UNI/USDT Long-Term Trend: Bearish (Daily Chart)

Key Price Levels:

Resistance: $14.00, $16.00, $18.00

Support: $13.00, $11.00, $9.00

Uniswap Price Prediction: UNI/USDT Eyes the $12.00 Support

The market retraced more strongly downward in the previous session. The current session has also preserved bearish momentum. Nevertheless, price action remains above the 50-, 100-, and 200-day Moving Average (MA) lines. Meanwhile, the Stochastic Relative Strength Index (RSI) lines are below the 50 threshold of the indicator. Also, the lines of this indicator have delivered a crossover, with the subsequent lines moving sideways.

Uniswap Price Prediction: UNI/USDT Prepares to Descend Lower

Price action in the Uniswap market appears prepared to continue downward. Price action has continued downward in the current session. Furthermore, downward forces have maintained their bearish momentum. Consequently, it appears that price action is likely to make another low.

However, the position of price action above the 50-day MA curve suggests that this technical landmark is an immediate support level. Nevertheless, considering the momentum, it seems price action may tend toward a more significant technical support level at the $12.00 price mark.

Uniswap Price Prediction: UNI/USDT Bearish Momentum Looks Refreshed (4-Hour Chart)

Even on the Uniswap 4-hour chart, price action can be seen diving further downward. The market consolidated in the past two sessions. Also, the 20- and 50-day MA lines are converging above the recent price action. Technically, price action lies below all the MA lines. The Stochastic RSI lines are also still falling into the oversold region.

Uniswap Price Prediction: UNI/USDT Eyes the $12.00 Support

Technically, it appears that price action is likely to fall lower considering all the available indications from this market. The fact that price action has appeared below all the MAs and below a crossing of the MA lines suggests that headwinds are in a position to push the market lower towards the $12.00 price level.

Get Uniswap here. Buy UNI