Crypto can be traded in many ways. Two of the most common styles are day trading and swing trading.
Both can work, but they require different personalities, schedules and risk habits.
What Is Day Trading?
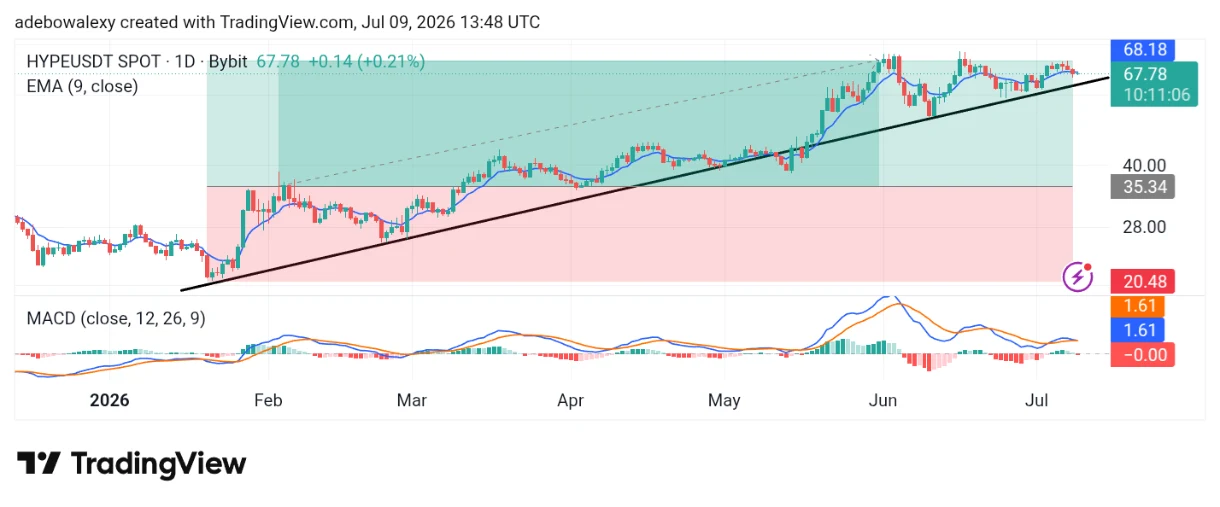
Day trading means opening and closing trades within the same day. A day trader may hold positions for minutes or hours, but usually avoids holding overnight.
The goal is to capture smaller intraday moves.
Day trading requires focus. You need to watch charts closely, react quickly and control emotions under pressure.
What Is Swing Trading?
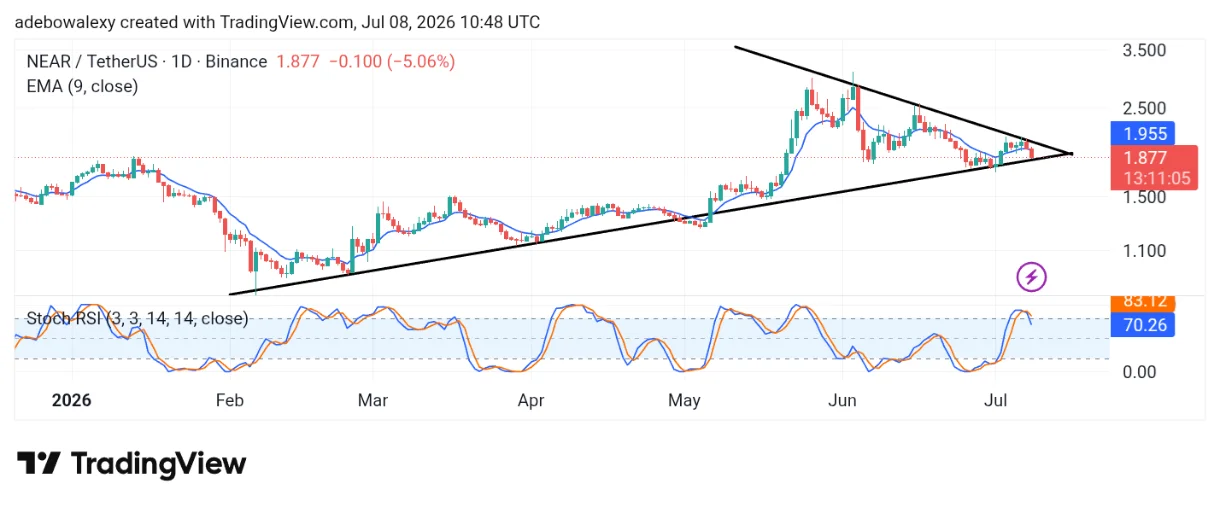
Swing trading means holding positions for longer, often several days or even weeks. A swing trader tries to catch a larger move within a broader trend or range.
Swing trading usually requires less screen time than day trading, but it still needs planning and risk management.

Free Crypto Signals Channel
![]() Free Telegram Channel
Free Telegram Channel
Pros of Day Trading
Day trading can offer more opportunities. You may avoid overnight news risk and close the day with no open exposure.
It can also provide faster feedback, which some traders like.
Cons of Day Trading
The downside is intensity. Fees, spreads and overtrading can add up. Emotional decisions happen quickly. Beginners often struggle because they take too many low-quality trades.
Day trading is not easy money. It is a demanding skill.
Pros of Swing Trading
Swing trading gives setups more time to develop. It can suit people with jobs or limited chart time. It may also allow cleaner planning around daily and 4-hour levels.
Because trades are fewer, quality can improve.
Cons of Swing Trading
Swing trades carry overnight and weekend risk. Crypto trades 24/7, so price can move while you sleep.
Stops and position sizing become especially important.
 Most Popular
- 2-5 Signals Daily
- 82% Success Rate
- Entry, Take Profit & Stop Loss
- Amount To Risk Per Trade
- Risk Reward Ratio
Which Is Better?
There is no universal answer. If you have time, discipline and fast decision-making skills, day trading may suit you. If you prefer slower decisions and bigger-picture setups, swing trading may be better.
Many beginners should start with swing trading because it reduces the pressure to constantly act.
The Bottom Line
Crypto swing trading and day trading are different games.
Choose the style that fits your schedule and personality. The best strategy is not the one that sounds exciting. It is the one you can follow consistently.
Need help applying this to live market conditions? Get instant access to our VIP trading signals here.