The Solana market hasn’t really changed its course from what was noted in the previous analysis. However, it has advanced further toward the more psychological support at the $120 price level, as previously highlighted.
Long-Term Trend—Bearish (Daily Chart)
Key Price Levels:
Resistance: $125, $130, $135
Support: $120, $115, $110
While the corresponding price candle for the ongoing session has appeared green, indicating that the market has rebounded upward, trading nevertheless remains below the 9-day Exponential Moving Average (EMA) line. At the same time, the Stochastic Relative Strength Index (SRSI) indicator lines can be seen converging for an upside crossover. This crossover has just occurred below the 50 threshold level of the indicator.
The Solana market has continued to descend into lower price levels. Be that as it may, the last price candle on this chart has appeared green and has pushed the market slightly upward. However, this move only keeps the market testing resistance at the 9-day EMA curve.
Meanwhile, the lines of the SRSI indicator are now converging for an upward crossover just below the 50 level of the indicator. Despite this, price action in this market still maintains a downward trajectory toward lower price levels.
Solana (SOL) Price Prediction: SOL/USDT Buyers Are Trying to Cause a Shift (4-Hour Chart)
Price movement in the Solana 4-hour market appears tilted toward attempting to break free from bearish pressure. The latest price candle on this chart is green and sits directly above the 9-day EMA curve.
Meanwhile, the lines of the SRSI indicator are above the 60 threshold but have a slight downward trajectory. Nevertheless, the behavior of the SRSI lines suggests a potential tilt toward a trend reversal.
While this market may be leaning toward an upside path, the move could be short-lived, as price action may still proceed toward the $120 price level.
The Bitcoin Cash market continues to form consistently higher lows, signaling sustained bullish interest as price action presses toward the critical $625 resistance level. This resistance has remained intact since September, making it a key technical barrier for the bulls.
Despite the resistance holding firm, buyers have maintained control of the broader structure. After the most recent rejection near $625 on December 20, bullish momentum quickly returned, with buyers stepping back in around the $569 support level. This renewed buying interest has once again positioned the market for a potential retest of the $625 resistance zone.
As long as higher lows remain intact, bullish pressure toward this key level is likely to persist.
Bitcoin Cash (BCH/USD) Market Data
BCH/USD Price Now: $600
BCH/USD Market Capitalization: $11.88 billion
BCH/USD Circulating Supply: 19.97 million BCH
BCH/USD Total Supply: 19.97 million BCH
BCH/USD CoinMarketCap Ranking: #11
Key Levels to Watch
Resistance: $600, $625, $650
Support: $576, $562, $550
Bitcoin Cash (BCH/USD) Daily Chart Perspective
From the perspective of the Bollinger Bands, Bitcoin Cash is maintaining an ascending price structure, reflecting an underlying bullish trend. The recent bull run gained strong upward traction before encountering firm resistance at the $625 price level.
The presence of sellers around this area triggered a pullback, pushing price action lower until bullish intervention emerged near the $570 support zone. From that level, Bitcoin Cash buyers regained control, driving a renewed upward move.
Although the market is currently facing resistance around the $600 price level, bullish sentiment remains intact. This strength is reinforced by the market’s ability to sustain higher lows, suggesting that buyers continue to defend key support areas and maintain pressure for further upside attempts.
BCH/USD 4-Hour Chart Outlook
From the 4-hour chart perspective, Bitcoin Cash is currently facing a tug-of-war around the $600 price level, a critical psychological and technical zone. This area represents a crossroads for the market, where demand and supply are closely balanced.
Despite this short-term indecision, momentum indicators still favor the bulls. The Relative Strength Index (RSI) is consolidating around 61, which remains firmly within bullish territory. This suggests that buyers retain a slight upper hand and may be positioning for another attempt to push the price higher, provided buying pressure strengthens and resistance at $600 is overcome.
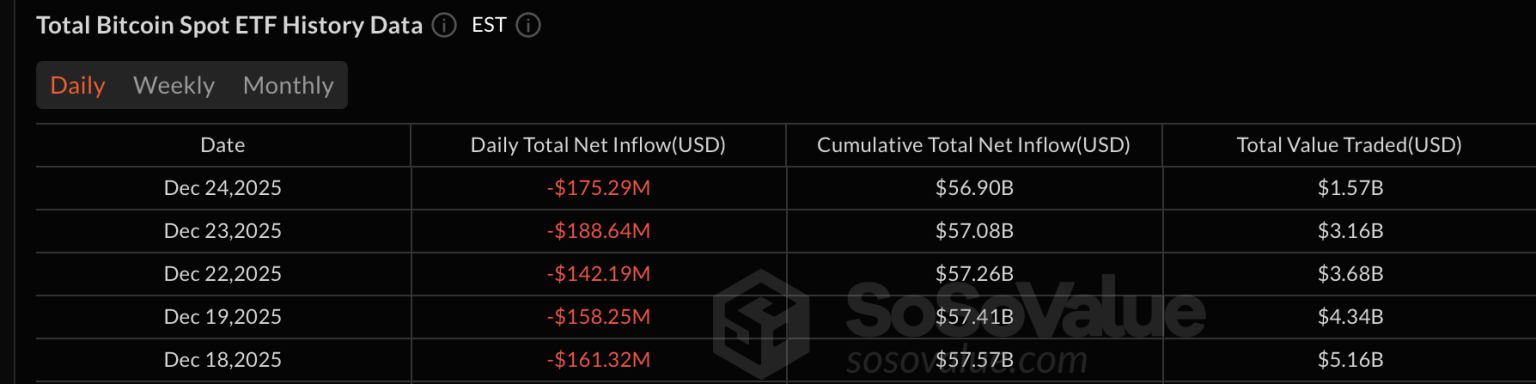
During the holiday season, the digital coin market has recorded extensive continued investor caution as the exchange-traded funds of major coins sustained increased outflow.
However, from another angle, XRP and Solana ETFs maintained steady inflows, a different story from that faced by Bitcoin and Ether.
To this end, this inflow and outflow analysis shows a shift in sentiment that goes in favor of altcoins despite market weaknesses.
Bitcoin and Ether ETFs Face Continued Selling Pressure
Bitcoin spot ETFs saw a net outflow of $175.29 million, marking the fifth consecutive day of withdrawals. As it stands, it was revealed that the outflows were spread across eight different funds. However, BlackRock’s IBIT took the largest hit, losing $91.37 million. Also, other notable funds like Grayscale’s GBTC and Fidelity’s FBTC also saw significant losses, as both funds saw outflows of $24.62 million and $17.17 million, respectively.
Source: Sosovalue.com
Meanwhile, smaller funds were not left out, as outflows were also recorded by other funds like Bitwise’s BITB.
Despite these outflows, the overall trading volume remained high at $31.57 billion, though total net assets for Bitcoin ETFs decreased slightly to $113.83 billion. Ether ETFs also closed the day in the red, with a net outflow of $52.70 million. Grayscale’s ETHE led the losses with $33.78 million, followed by BlackRock’s ETHA with $22.25 million in exits. The only positive movement came from Grayscale’s Ether Mini Trust, which saw a modest $3.33 million inflow. The total trading volume for Ether ETFs dropped to $689.44 million, and net assets remained steady at $17.86 billion.
XRP and Solana ETFs See Continued Growth
In contrast, XRP ETFs continued to see inflows, adding $11.93 million on the day. Franklin’s XRPZ fund was responsible for the bulk of the activity, with an $11.14 million inflow, while Canary’s XRPC added a smaller $794K. At the time of writing, the total value traded for XRP ETFs was $10.84 million, and net assets remained thesame at $1.25b. Additionally, Solana ETFs posted modest gains, recording a $1.48 million inflow. As it stands, Fidelity’s FSOL received the largest share of this inflow with $1.08 million, followed by Vaneck’s VSOL, which saw an addition of $399K. Also, trading volume for Solana ETFs reached $15.77 million, as total net assets remained at $930.59 million.
Put together, the Christmas Eve trading session highlights a market with caution from investors as Bitcoin and Ethereum continue to witness constant outflow.
Lucky Block exhibits steady strength with a positive gain of over 1.5% across timeframes, demonstrating resilience and consistent buyer interest during typically lower-volume holiday trading. This constructive price action suggests LBLOCK is maintaining its bullish foundation and positioning itself for continued upward movement as market activity normalizes.
Daily Chart Analysis: Solid Foundation Above Key Support
The daily chart reveals LBLOCK successfully holding above critical support levels while making measured upward progress. The Parabolic SAR indicator continues to provide a supportive structure, with its positioning suggesting the overall trend remains favorable. The MACD, while showing neutral momentum, maintains a configuration that allows for positive momentum to develop as buying pressure increases.
LBLOCKUSDT – Daily Chart
Key resistance levels to watch are 0.00001755, 0.00002000, and 0.00003000. These represent achievable targets for the next wave of bullish momentum. On the support side, 0.00001390 now serves as immediate foundation, with stronger levels at 0.00001170 and the psychological 0.00001000 level providing substantial downside protection.
4H Chart Analysis: Building Positive Momentum
The 4-hour chart shows a consistent upward trajectory with the price action maintaining its position above recent support zones. The Parabolic SAR aligns with this constructive outlook, providing dynamic support for the asset’s gradual appreciation. The MACD indicator on this timeframe reflects the steady accumulation phase, setting the stage for potential momentum acceleration.
Immediate resistance is encountered at 0.00001755, with subsequent targets at 0.00002000 and 0.00003000. The current structure finds reliable support at 0.00001390, backed by stronger zones at 0.00001170 and 0.00001000, creating a well-defined risk-reward framework for traders.
LBLOCKUSDT – 4H Chart
Conclusion: Positioned for Continued Advancement
Lucky Block continues to demonstrate technical strength with its ability to maintain gains and hold critical support levels during holiday trading. The steady upward movement reflects underlying buyer confidence and sets the stage for potential accelerated gains as trading volume returns to normal levels. With a clear support structure in place and defined resistance targets overhead, LBLOCK remains well-positioned for continued positive price action in the coming sessions.
Invest wisely, and let Lucky Block’s potential work in your favor. You can purchase Lucky Block here.Buy LBLOCK
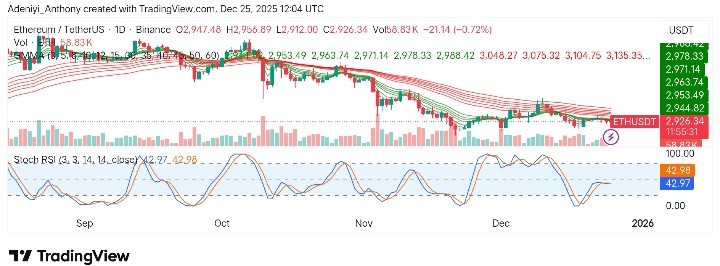
The market for Ethereum against Tether appears to be struggling, operating around the same spot for an extensive period of time. As it stands, the price seems to be testing crucial support levels as the technical indicators reflect a bearish sentiment.
As it stands, on-chain data shows consistent selling pressure, as the pair failed to break above recent resistance levels, as crypto news signals a lack of direction.
Major Resistance Levels: $2,946, $3,075, and $3,135
Major Support Levels: $2,918, $2,830, and $2,800
Technical Analysis
Technically, Ethereum against Tether on the daily chart appears to be building a base at $2,900 after a strong downtrend from $3,400 in recent times.
At the time of writing, the pair is operating under the cluster of Guppy Multiple Moving Averages (GMMA) with a bearish sentiment. However, recent actions suggest the price is preparing for a directional break. This is evident as the Stochastic RSI signals an extension of the range-bound activity.
To this end, an improvement alone from the indicators without a move to $2,975 doesn’t warrant an upside move, as any point below that would indicate further downside.
$ETH
Ethereum is sitting in the same micro support zone as before. There’s no change to the outlook at this stage. A move above $2,975 would still be the first indication that a short-term low may be in place. pic.twitter.com/QSa7PMVbAh
$ETH
Ethereum is sitting in the same micro support zone as before. There’s no change to the outlook at this stage. A move above $2,975 would still be the first indication that a short-term low may be in place. pic.twitter.com/QSa7PMVbAh
Meanwhile, @Morecryptoonline suggests Ethereum is currently positioned within the same micro support zone as before. As it stands, the analyst is of the opinion that a move above $2,975 would serve as the first indication that a short-term low may have been reached, and a potential upward shift is in play.
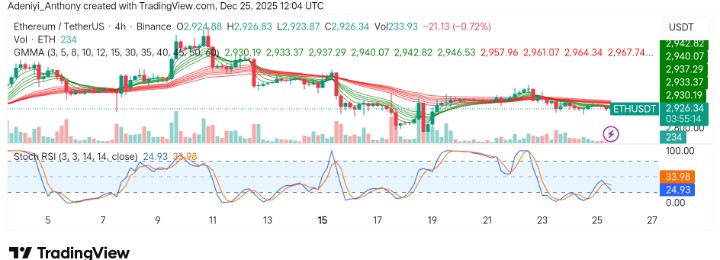
ETH/USDT Analysis: Operating Within Same Zone: What’s Next?
On the 4-hour chart, ETH/USDT seems to be operating within a tight space over an extensive period of time. As it stands, the GMMA lines are technically showing that both scalpers and investors are Unsure of the direction. Meanwhile, the SRSI is showing the market is neutral. To this end, caution is advised, as a breakout to either side remains indecisive.
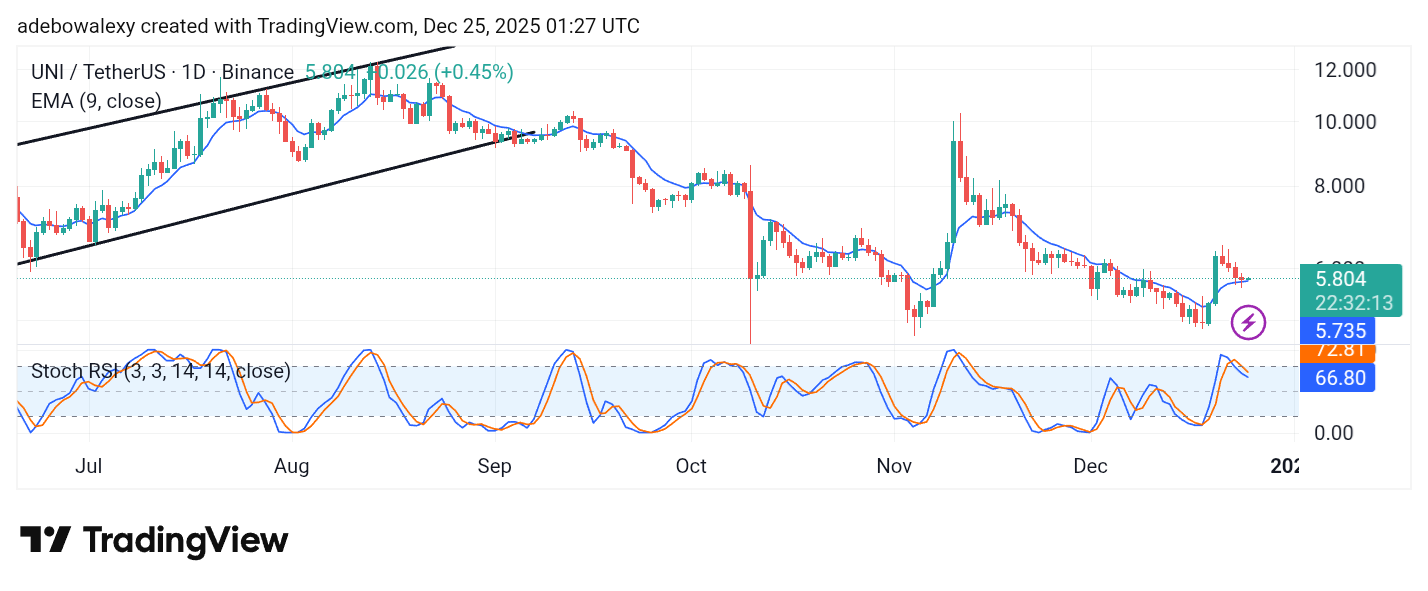
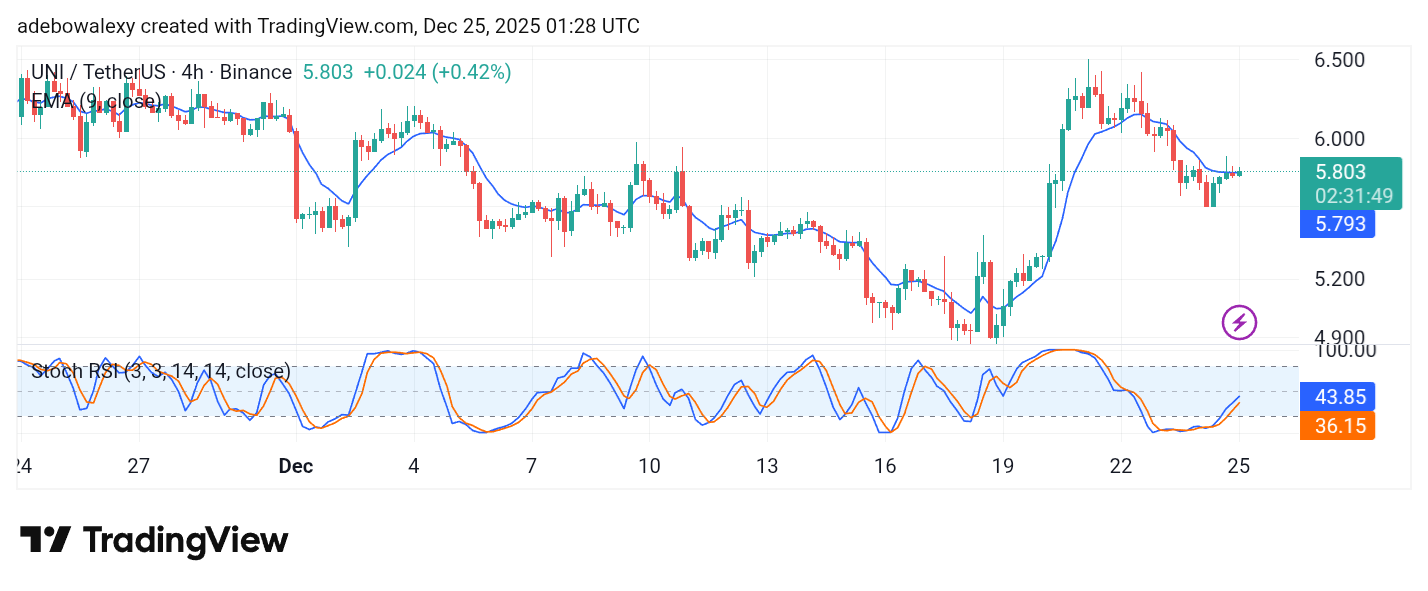
The Uniswap market previously rebounded strongly from support near the $4.00 price level. However, that recovery lacked follow-through, causing price action to retreat once again below the $6.00 threshold.
UNI/USDT Long-Term Trend — Bearish (Daily Chart)
Key Price Levels
Resistance: $6.00, $7.00, $8.00
Support: $5.50, $5.00, $4.50
Although Uniswap price action had recently declined toward support near the 9-day Exponential Moving Average (EMA), the ongoing session shows a modest bullish stance. The latest candle is positioned just above the 9-day EMA. Meanwhile, the Stochastic Relative Strength Index (SRSI) indicator lines maintain a generally downward slope, though their endpoints show slight sideways movement, suggesting weakening bearish momentum.
Uniswap Price Prediction: UNI/USDT Buyers Attempt to Hold Ground
At the time of writing, the Uniswap daily chart indicates that buyers are attempting to prevent price action from slipping below the 9-day EMA. The green candle forming just above this moving average suggests renewed buying interest.
However, the SRSI indicator lines continue to trend slightly lower, implying that bullish momentum remains fragile. Traders may want to wait for confirmation, particularly whether price action holds above the 9-day EMA. A sustained break below this level could indicate further downside, while a successful defense may support another upward attempt.
On the 4-hour chart, UNI is trading marginally above the 9-day EMA. The most recent candle is bullish but appears compressed, with its base dipping below the EMA while the close finishes just above it.
This reflects hesitation among market participants. Meanwhile, the SRSI indicator lines continue to slope upward, supporting a short-term bullish bias. Despite the mixed signals, technical indicators suggest that upside forces could still attempt to push the market toward the $6.00 resistance level in the near term.
The crypto billionaire list of 2025 tells a powerful story about how wealth is being created in the digital age. Once dismissed as a fringe experiment, cryptocurrency has evolved into a full-fledged financial ecosystem capable of producing some of the world’s richest individuals. From exchange founders and early Bitcoin believers to unexpected newcomers like Donald Trump, these figures illustrate how innovation, timing, and risk-taking intersect in blockchain-driven wealth.
What makes this year’s list especially compelling is its diversity. Some fortunes were built through infrastructure—exchanges, stablecoins, and protocols—while others emerged from branding, speculation, and cultural relevance. Together, they reflect how crypto continues to blur the lines between finance, technology, and public influence.
Donald Trump Enters the Crypto Billionaire Circle
One of the most surprising names on the 2025 list is Donald Trump. Best known for real estate and politics, Trump entered the crypto space through NFT collections and the launch of his branded token, $TRUMP. Leveraging global name recognition, these projects quickly attracted attention and capital, propelling him into crypto billionaire status.
Trump’s crypto journey highlights a defining feature of modern digital assets: visibility and narrative can be just as powerful as technology. While critics question the long-term sustainability of such projects, their short-term success underscores how blockchain enables new, unconventional paths to wealth creation.
Changpeng Zhao: Building the Rails of Crypto Finance
At the top of the list sits Changpeng “CZ” Zhao, founder of Binance, with a fortune exceeding $65 billion. Zhao’s wealth is largely tied to Binance Coin (BNB) and the explosive growth of Binance into the world’s largest crypto exchange.
Launched in 2017, Binance expanded rapidly by offering low fees, global access, and a broad ecosystem spanning spot trading, derivatives, DeFi, and NFTs. Despite facing intense regulatory scrutiny across multiple jurisdictions, Zhao’s ability to adapt and scale has kept Binance central to global crypto liquidity. His rise shows that building financial infrastructure—rather than simply trading assets—can be the most powerful wealth engine in crypto.
Bitcoin Believers and Institutional Builders
Several crypto billionaires owe their fortunes to early and unwavering belief in Bitcoin. Michael Saylor, executive chairman of MicroStrategy, famously converted his company’s balance sheet into a Bitcoin treasury, turning corporate adoption into a mainstream narrative. His bold strategy made him one of Bitcoin’s most vocal advocates and one of its richest beneficiaries.
Similarly, investors like Matthew Roszak and the Winklevoss twins entered Bitcoin early, long before institutional interest arrived. Through ventures such as Gemini and blockchain investment firms, they helped legitimize crypto in regulated markets while benefiting from Bitcoin’s long-term appreciation.
Stablecoins and the Power Behind the Scenes
Another major theme on the 2025 list is the dominance of stablecoins. Executives behind Tether (USDT)—including Giancarlo Devasini, Paolo Ardoino, Jean-Louis van der Velde, and Stuart Hoegner—have built enormous wealth by operating the backbone of crypto trading liquidity.
Stablecoins may lack the excitement of volatile tokens, but they are essential to global crypto markets, facilitating the majority of daily trading volume. Despite ongoing regulatory scrutiny, Tether’s scale and profitability demonstrate how foundational financial plumbing can be just as lucrative as speculative innovation.
Ethereum, DeFi, and Platform Growth
Figures like Brian Armstrong and Fred Ehrsam, both associated with Coinbase and early Ethereum adoption, represent another path to crypto wealth. By providing compliant, user-friendly gateways into digital assets, Coinbase became a cornerstone for retail and institutional investors alike.
Ethereum’s rise—through staking, decentralized finance, and smart contracts—has further amplified their fortunes. These stories show how aligning with programmable blockchain platforms can unlock compounding value far beyond simple asset appreciation.
Builders, Risk-Takers, and Visionaries
Other notable figures, such as Justin Sun of TRON and Chris Larsen of Ripple, demonstrate crypto’s global reach and its willingness to reward aggressive builders. While often controversial, their projects pushed blockchain into payments, content distribution, and cross-border finance, expanding crypto’s real-world relevance.
What the 2025 List Really Represents
The crypto billionaire list of 2025 is about more than money. It reflects a financial system still being written—one where code, networks, and narratives can create wealth at unprecedented speed. These individuals succeeded not because crypto was safe or predictable, but because they embraced uncertainty before it became mainstream.
From Trump’s brand-driven entry to Zhao’s infrastructure empire, one lesson stands out: blockchain is not just changing how wealth is stored—it’s redefining how wealth is created. And as crypto continues to evolve, this list is likely only the beginning.
The API3 market has experienced heightened volatility in recent sessions, particularly after bulls stepped in decisively at the $0.37 price level. This intervention triggered a strong rebound, signaling renewed buying interest.
However, the bullish recovery is now facing notable resistance near the $0.46 level. This resistance appears to be slowing the upward momentum, causing volatility to ease as price action stabilizes around the $0.44–$0.46 zone.
If buyers manage to absorb selling pressure in this area and maintain control, the market could attempt another push higher, with a potential upside target near the $0.60 level. Conversely, failure to clear this resistance may keep the price ranging in the short term as bulls and bears remain in balance.
API3 Market (API3/USD) Market Data
API3/USD Price Now: $0.44
API3/USD Market Capitalization: $38.12 million
API3/USD Circulating Supply: 86.4 million API3
API3/USD Total Supply: 156.8 million API3
API3/USD CoinMarketCap Ranking: #491
Key Levels to Watch
Resistance: $0.46, $0.50, $0.55
Support: $0.40, $0.35, $0.30
API3 Market (API3/USD) Daily Chart Perspective
Despite the recent impressive recovery in the API3 market, the broader trend on the daily chart remains bearish. A key test for the ongoing bullish rebound lies at the $0.46 price level, where price action must break above and sustain itself to confirm a meaningful trend reversal.
This level is particularly significant as it aligns with the current position of the 20-day moving average. A decisive breakout above this zone would strongly suggest a shift in market structure from bearish to bullish.
At present, however, price action appears to be facing rejection at this critical resistance. As a result, the crypto signal may enter a consolidation phase around the $0.46 level while traders assess whether bulls have enough momentum to push higher or whether bears will regain control.
API3/USD 4-Hour Chart Outlook
From the lower timeframe perspective, specifically the 4-hour chart, price action appears to be preparing for a possible consolidation around the $0.46 level. Both demand and supply are converging near this price zone, suggesting a period of indecision in the market.
While the broader daily chart still places the market within a bearish zone, the 4-hour chart shows price trading slightly above the midpoint, indicating a modest bullish advantage in the short term.
However, despite this slight upper hand, a decisive breakout above the $0.46 resistance remains crucial for the continuation of the bullish recovery. Failure to clear this level could result in prolonged consolidation or renewed selling pressure.
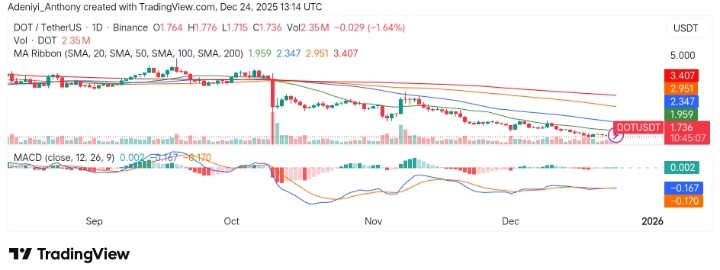
Polkadot against Tether in the last 24 hours has dropped by 2.2% to $1.72, underperforming the broader crypto market decline of 0.86%. As it stands, this decline is part of a larger downtrend, as the coin records 7.8% on the weekly chart and 25% over the month. From a technical point of view, one key factor behind this drop is a failure to maintain the critical support level of $1.76, which has triggered an even more bearish trend.
From another angle, Polkadot’s underperformance can be linked to the overall market’s risk aversion due to Bitcoin’s dominance rising to 59.1%. To this end, it is apparent that weak interest from investors affects the pair as trading volume lowers by 9%, suggesting reduced buying momentum.
Major Resistance Levels: $1.959, $2.347, and $2.951
Major Support Levels: $1.715, $1.690, and $1.500
Technical Analysis
Technically, Polkadot against Tether on the daily timeframe appears to be testing the support at $1.715, trending downward as the price continues to act under the cluster of the simple moving averages. Additionally, the moving averages on the chart show the bears are still dominating, as the MACD shows no sign of an impending directional break.
As it stands, if the bulls fail to increase participation, a move towards $1.500 may be noticeable in the near term.
$DOT is compressing inside a descending triangle on the daily chart.
Price is sitting right on key horizontal support (~1.75) — pressure is building.
🔻 Lose support → continuation to the downside
🔺 Hold & reclaim trendline → relief bounce possible
Meanwhile, @EricCrypto21M has discussed Polkadot’s current price action, stating that the token is forming a descending triangle on the daily chart. The analyst is of the opinion that the price is sitting at a crucial horizontal support level around 1.75, indicating that pressure is building. It was suggested that if DOT loses this support, a further downside move would erupt, but a bounce would surface if the token reclaims the trendline.
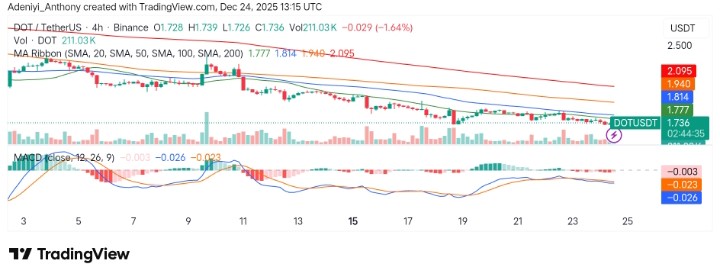
DOT/USDT Analysis: Is a Break above $1.77 Possible?
DOT/USDT on the 4-hour chart appears to be encountering resistance near the $1.777 level, with a downward slant forming. Additionally, the MACD seems to be showing negative bars depicting increasing bearish pressure even as the price operation remains limited under the moving averages.