Wall Street Memes (WSM/USD) Price Bottoms, Making Bounces

Wall Street Memes Price Prediction – January 12

The price pathway that led to tangible pulling forces to the southward in the business dealings of Wall Street Memes coin against the trade worth of the US currency is bottoming, making bounces above the line of $0.0007.

The cryptocurrency market is now trading at about $0.00094264 between the lower and middle Bollinger Bands’ trend lines. As the base instrument tends to move downward around the indicators, it would be prudent to execute yearning position orders with the intention of letting the positions run in a long-term mode so that they may quickly play alongside any tenable, scared rebounds.

WSM/USD Market
Key Levels
Resistance levels: $0.0012, $0.0017, $0.0022
Support levels: $0.0007, $0.0005, $0.0003

WSM/USD – 4-hour Chart

The WSM/USD 4-hour chart showcases that the crypto-economic market is bottoming, making bounces above the value of $0.0007.

The Bollinger Bands’ trend lines have been positioned so they fall between the $0.0012 and $0.0007 horizontal lines. Additionally, the candlesticks’ use has been helping people make wise purchases in a certain reduced trade zone. The stochastic oscillators have currently veered north into the overbought area, indicating that the market is probably going to have a temporary halt before experiencing more upward pressures.
Wall Street Memes (WSM/USD) Market Is Bottoming, Making Bounces

What is the current trading tempo of the WSM/USD market, which is now trading at roughly $0.0009?

The current trade outlook pattern that the WSM/USD market now keeps is that bears are tending to end moves while tending to go downward around the trend line of the lower Bollinger Band, given that the situation now shows that the price is bottoming, making bounces above the point of $0.0007.

Since the cryptocurrency market has been forced to shift valuation to significant depreciation zones, it is psychologically ideal for investors to start staking operations based on that sentiment. This is because, should the trend be able to establish stable positions, the subsequent price movements will turn significantly in order to break through variant resistances.
Wall Street Memes (WSM/USD) Market Is Bottoming, Making Bounces

WSM/USD 1-hour chart

The 1-hour chart showcases the crypto-economy is bottoming, making bounces at a given lower end above $0.0007.

Candlestick formation has been observed in ranges where lower highs predominate over lower lows for the majority of signs. The Bollinger Bands’ trend lines have been extending eastward, indicating that the primary competing barrier location is about $0.001. The stochastic oscillators have been veering up and down through a range of values under a bearish signal configuration that is quickly losing its significance. Therefore, instead of thinking about selling off their points in a needless frenzy, purchasers should persist in carrying out yearning orders.

Buy and stake WSM now!: Wall Street Meme (WSM): https://wallstmemes.com/

Chainlink (LINK/USDT) Consolidates Near $18.89

Chainlink Long-term Analysis: Ranging

After hitting $24.78, Chainlink against the Tether has experienced significant volatility in recent weeks. However, the pair appears to have pulled back, as seen in the $15.22 price dip.

The indicators on the chart show the pair is acting under selling pressure. However, the price positioning around the Guppy Multiple Moving Averages (GMMAs) suggests Chainlink traders can re-enter the market, but the Stochastic RSI still operates in the neutral zone.

Currently, Chainlink trades at $19.99 with over 34 million weekly traded volumes.

Chainlink (LINK/USDT) Consolidates Near $18.89
LINKUSDT-Weekly Chart

Technical Indicators

Major Resistance Levels: $20.94, $22.00, and $24.78

Major Support Levels: $18.89, $16.72, and $15.00

Chainlink Technical Analysis

On the weekly timeframe, Chainlink against the Tether appears to range close to $18.89 after experiencing a sharp dip. However, as the market remains cautious, indicators on the chart point to weakness in the current decline; a decisive move above $21.00 could indicate renewed bullishness. Moreover, if the price dips below $18.89, the $16.72 may be the next support level to watch out for.

Additionally, the positioning of the Stochastic lines signals the price is consolidating before making a decisive move. This can be seen in the slight convergence of the lines, indicating a recovery might be on the horizon. However, further deepening of the lines could hint at continued bearish pressure.

LINK/USDT Analysis: Expectations

On the daily timeframe, LINK/USDT is down by 1.09%, signaling continued bearish momentum. However, the convergence of the GMMAs shows the market lacks direction with reduced long-term bullish momentum as the long-term EMAs flatten out.

On the other hand, the Stochastic RSI indicates an oversold condition for the pair. However, the appearance of the lines below the 20-mark level suggests the current trend may be waning and price may bounce to the North if bullish traders step in.

To this end, as the volume increases, a break above $20.15 would confirm the recovery; otherwise, a break below the current level indicates the continuation of price deepening.

Chainlink (LINK/USDT) Consolidates Near $18.89
LINK/USDT-Daily Chart


You can purchase crypto coins here. Buy LBlock

Tamadoge (TAMA/USD) Poised for a Potential Upswing

The ongoing struggle between demand and supply continues, keeping the Tamadoge price fluctuating around the $0.000845 level. However, the market now appears to be gearing up for a potential breakout, which could drive the price above the critical $0.001 threshold.

The bearish momentum seems to have stalled near this support level, with demand and supply currently in equilibrium. This balance suggests a possible rebound, creating an opportunity for the Tamadoge price to ascend to a higher level. Traders should monitor this zone closely, as it could mark the start of a significant upward move.

Key Levels

  • Resistance: $0.0018, $0.0019, and $0.0020
  • Support: $0.001, $0.0009 and $0.0008

Tamadoge (TAMA/USD) Poised for a Potential Upswing

TAMA/USD Price Analysis: The Indicators’ Point of View

As the market stabilizes around $0.00084, the Bollinger Bands are converging, indicating a volatility squeeze. This pattern often signals the potential for a significant crypto price movement, possibly leading to a breakout and a climb to higher price levels.

The horizontal movement of candlesticks, the emergence of small-bodied candlesticks, and the narrowing price channel formed by the Bollinger Bands typically suggest an imminent market shift. This phase, known as consolidation, represents a period of reduced volatility as the market prepares for its next move.

Given that this phenomenon is occurring after a notable bearish trend, there is a strong likelihood of a rebound, with the market poised to break out to higher levels. Traders should closely monitor this development and strategically position themselves to capitalize on the opportunities it presents.

Tamadoge (TAMA/USD) Poised for a Potential Upswing

Tamadoge Short-Term Outlook: 1-Hour Chart

A closer examination of the 1-hour chart for the TAMA/USD market reveals recent attempts by the bulls to drive the price upward. However, these efforts encountered resistance around the $0.00083 level, indicating that consolidation remains firmly in place. This suggests that bearish sentiment still exerts influence near the $0.00083 price point.

While this scenario points to the continuation of the consolidation phase, traders should remain vigilant, as a potential bounce may be on the horizon. Preparing for a breakout in either direction is advisable to capitalize on emerging opportunities.

Buy TAMA/USD!

Buy TAMA today!

Top Trending Coins for Today, January 12: GRS, HIVE, BGB, BOUNTY and IOTA

Today, the cryptocurrency market is experiencing a significant upturn. As observed on the CoinMarketCap platform, the top four featured markets are showing notable recoveries and bullish momentum. Among them, the Groestlcoin (GRS) market, known for its focus on privacy, is leading the pack, followed closely by the Hive market. However, the IOTA market has been underperforming, remaining below the bullish threshold.

Let us now dive deeper into today’s market analysis, examining the implications of key indicators driving these movements.
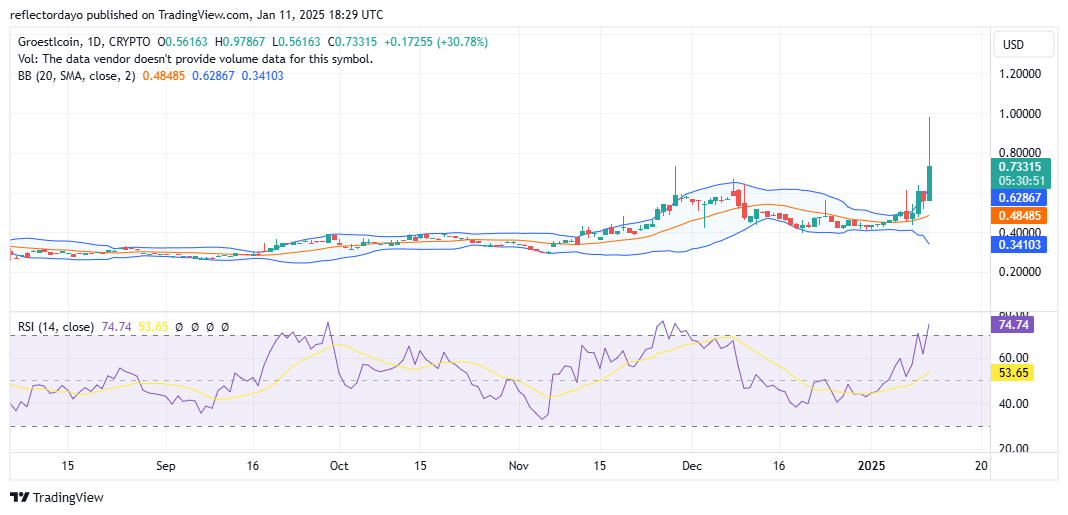
Groestlcoin (GRS)

Major Bias: Bullish

Groestlcoin (GRS), a privacy-focused cryptocurrency, is leading the market today with an impressive 34.2% gain over the past 24 hours. The most recent trading session reflects a sharp upsurge in price, followed by significant profit-taking activity. Previously, the bearish resistance at the $0.60 price level posed a major obstacle. However, today’s bullish breakout has successfully breached this level.

The strong upward momentum has now turned the $0.60 resistance into a potential support level. Should the ongoing market correction bring prices back to this level, it is likely to serve as a solid foundation for renewed bullish activity.

From a technical perspective, indicators such as the Relative Strength Index (RSI) and Bollinger Bands suggest the market is primed for a correction, as the price action indicates overbought conditions. Key levels to monitor during this correction include $0.70 and $0.60. If the price fails to hold above $0.70, it is highly likely to regroup at the $0.60 level for potential consolidation.

Current Price: $0.731

Market Capitalization: $63 million

Trading Volume: $796 million
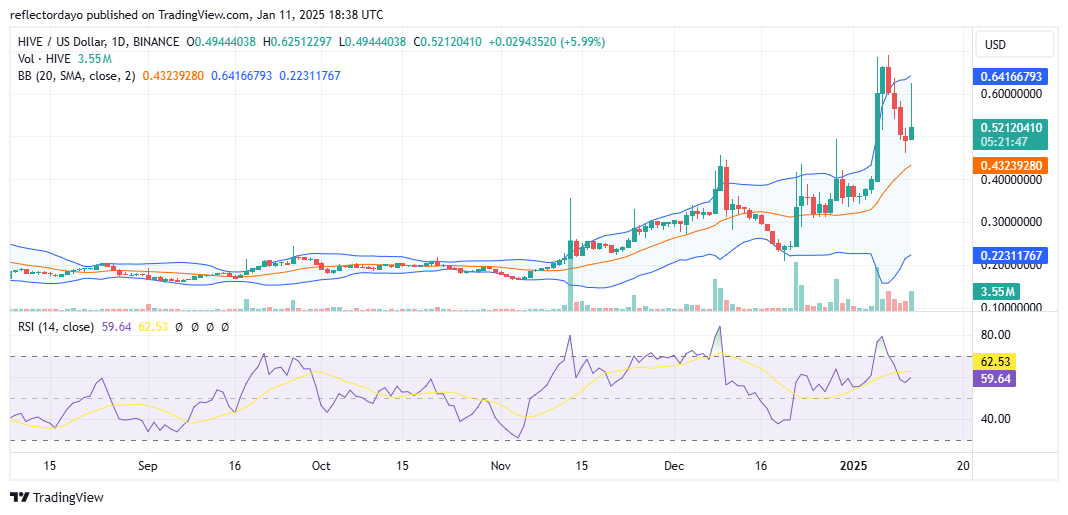
Top Trending Coins for Today, January 11: GRS, HIVE, BGB, BOUNTY and IOTA

Hive (HIVE)

Major Bias: Bullish

Hive, the second market on the list, exhibits a similar price action to the Groestlcoin (GRS) market discussed earlier. However, unlike GRS, which took approximately three days to reach its peak, Hive’s bullish momentum began earlier, on Sunday, January 5, marking the start of the week.

This strong bullish move significantly increased market volatility, but the bulls successfully leveraged it to secure their position around the $0.50 price level, rising from approximately $0.30. Currently, the market shows bulls attempting to solidify their hold at this newly established $0.50 price level.

What is likely to occur at this stage is a potential weakening of bearish pressure, leading to price consolidation around $0.50. This consolidation could strengthen the level as a robust support zone, paving the way for the continuation of the uptrend.

Current Price: $0.5187

Market Capitalization: $259 million

Trading Volume: $548 million
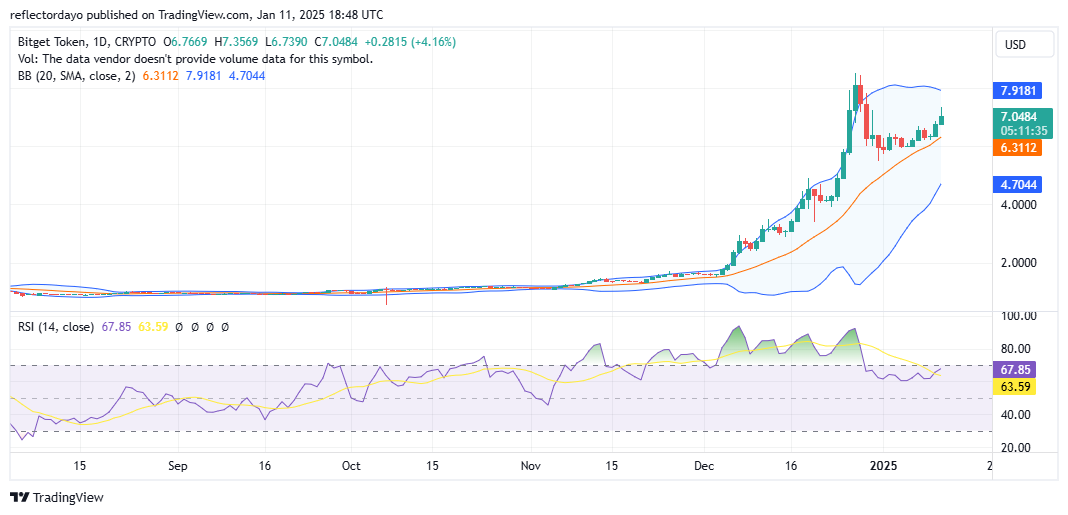
Top Trending Coins for Today, January 11: GRS, HIVE, BGB, BOUNTY and IOTA

Bitget Token (BGB)

Major Bias: Bullish

The Bitget Token (BGB) market has remained relatively stable around the $1.00 price level for an extended period. However, this changed recently as the market gained momentum, leading to a significant and sustained upward trend starting in December of last year. This bullish rally peaked at approximately $8.00 toward the end of the year.

Since the beginning of 2025, the crypto signal has been consolidating around the $6.00 price level. Over the past two days, price action has shown gradual upward movement, reaching $7.00 and gaining traction toward the $7.50 level. For now, the price seems to have stabilized at $7.00, indicating a balance between demand and supply at this point.

As a result, the market may consolidate further around this level, potentially establishing a strong support zone. However, the Bollinger Bands indicator suggests that market volatility remains high. This implies that the emergence of a stable price level at $7.00 may take longer than expected until volatility subsides.

Current Price: $7.07

Market Capitalization: $8.5 million

Trading Volume: $678 million

Top Trending Coins for Today, January 11: GRS, HIVE, BGB, BOUNTY and IOTA

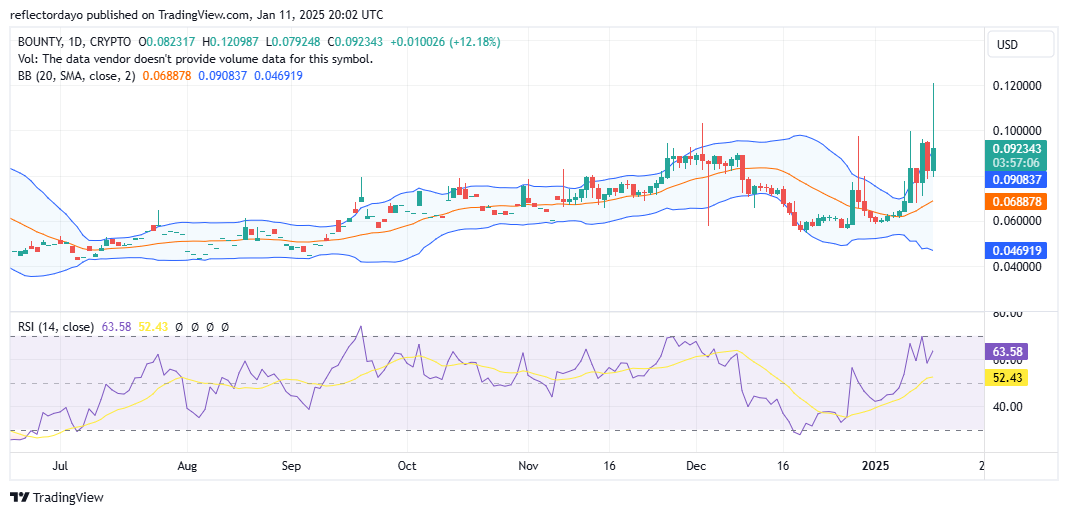
Chainbounty (BOUNTY)

Major Bias: Bullish

The market was caught in a consolidation phase around the $0.06 price level during the second half of December last year. It eventually gained sufficient strength to break out of this range. This week has been particularly pivotal for the bullish momentum, as the market has shown significant upward movement.

The persistent bullish drive has led to increased market volatility. Optimistic traders capitalized on this volatility by breaking through the $0.08 resistance level and reclaiming it as a higher support. With this level secured, the bulls have now shifted their focus toward the $0.10 price level, with potential aspirations of reaching $0.12.

However, the market may first stabilize around $0.08 to mitigate volatility and consolidate this level as a solid support zone. Establishing such a foundation would be critical for sustaining further upward price movements.

Current Price: $0.0923

Market Capitalization: $47 million

Trading Volume: $352 million
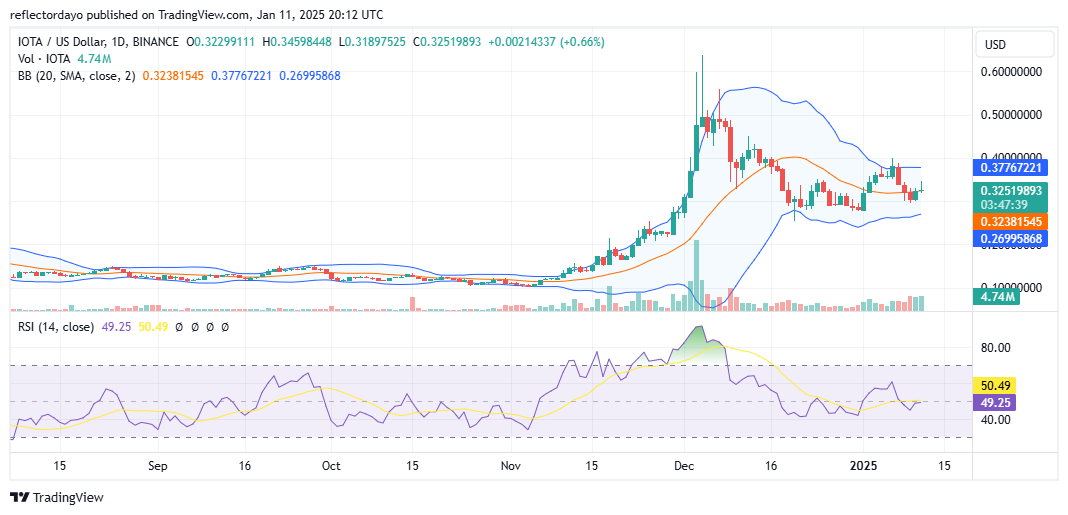
Top Trending Coins for Today, January 11: GRS, HIVE, BGB, BOUNTY and IOTA

IOTA (IOTA)

Major Bias: Bullish

In the final position today is the IOTA market. Analyzing its performance from the daily chart perspective, there is a possibility that the market is preparing to consolidate around the $0.32 price level. Indicators suggest that the market is becoming increasingly stable, as evidenced by the narrowing of the Bollinger Bands, indicating a progressive reduction in price volatility.

The Relative Strength Index (RSI) also reflects balanced market momentum, with the RSI settling near the midpoint of the scale. This pattern appears consistent with trends observed across several other markets.

The IOTA market seems to be stabilizing around the $0.32 level, potentially establishing it as a strong support zone. This consolidation could pave the way for further bullish movements, with the price likely targeting the $0.40 level and, potentially, $0.50 in the near future.

Current Price: $0.325

Market Capitalization: $1.2 billion

Trading Volume: $178 million

Top Trending Coins for Today, January 11: GRS, HIVE, BGB, BOUNTY and IOTA

Trade crypto coins on BYBIT!

Pepe Unchained (PEPUUSD) Aims to Establish Momentum at the $0.015 Price Level

Pepe Unchained (PEPU) is a meme coin launched on December 10, 2024, on Uniswap. Built on a Layer 2 blockchain, it offers faster transaction speeds and lower costs compared to traditional Ethereum-based transactions, enhancing the efficiency of meme coin trading.

The chart reveals the earliest recorded data from December 17, 2024, showcasing a dynamic market. The candlestick pattern observed is a spinning top, indicative of heightened trading activity and market enthusiasm.

The Pepe Unchained market debuted at an initial price of $0.0001 per token and experienced a remarkable surge on its first trading day, climbing by 200% to reach $0.0003. This early performance highlights strong investor interest and market excitement around the token.

Key Levels to Watch:

  • Resistance: $0.014, $0.015, and $0.016
  • Support: $0.011, $0.010, and $0.009

Pepe Unchained (PEPUUSD) Aims to Establish Momentum at the $0.015 Price Level

Pepe Unchained Price Analysis from an Indicator Perspective

The Pepe Unchained market’s performance, with a staggering 200% gain shortly after its launch, highlights immense enthusiasm and high expectations from investors. This early surge drove the market upward, fueled by strong trading activity, as reflected in the trading volume indicators. During this period, investors reaped substantial profits as the price skyrocketed to an impressive $0.025. However, a wave of profit-taking triggered a bearish pullback, causing the market to retreat to $0.01.

At the $0.01 level, a tug-of-war between bulls and bears ensued, leading to a price standstill. Currently, the market shows signs of an emerging consolidation trend around this level. Volatility has cooled off, and the trading volume histograms indicate a decline, reinforcing the $0.01 price point as a strong support level. This consolidation phase could pave the way for a potential recovery or rally, with the price eyeing $0.015 or even higher.

The ongoing crypto signal action suggests an upward movement, although bearish resistance remains substantial. At present, the price is undergoing a corrective phase, reflecting the interplay of bullish recovery attempts and bearish pressures.

Pepe Unchained (PEPUUSD) Aims to Establish Momentum at the $0.015 Price Level

Short-Term Outlook for PEPUUSD: 1-Hour Chart

Zooming in on the 1-hour chart, we observe the bulls actively driving the market. The Relative Strength Index (RSI) surged into the overbought region, reflecting heightened investor expectations and relentless speculation pushing the market upward despite facing significant bearish corrections.

The RSI recently corrected from 74 to 69, which could prompt some traders to adopt a more cautious or bearish stance. However, the strong desire among traders to engage in this market remains evident. This is underscored by the appearance of a doji in recent trading sessions, following a brief correction from the $0.013 level.

The ability of traders to hold their ground against bearish pressure at this point highlights the ongoing bullish momentum in the market. The current price action suggests that buyers remain resilient, keeping upward pressure alive despite recent resistance.

Buy PEPU Now!

Buy and stake NOW on the L2 for DOUBLE staking rewards!: Pepe Unchained (PEPU)

POL (ex-MATIC) Price Prediction: POL/USDT Market May See a Bullish Breakout Soon

POL (ex-MATIC) Price Prediction (January 11):

Since price activity in the POL (ex-MATIC) market poked through the $0.7000 price level, this market has been retracing to lower price levels. However, now it appears that this market is preparing for another breakout.

POL/USDT Long-Term Trend: Bearish (Daily Chart)

Key Price Levels:

Resistance: $0.5000, $0.5500, $0.6000

Support: $0.4500, $0.4000, $0.3500

POL (ex-MATIC) Price Prediction: POL/USDT Market May See a Bullish Breakout Soon

The ongoing session has brought a minor downward retracement to this market. Nevertheless, price action continues to hover around the 100-day Moving Average (MA) lines. Meanwhile, the Stochastic Relative Strength Index (RSI) lines can be seen pointed towards the oversold region of the indicator. Likewise, the terminals of these indicator lines are converging just below the 20-threshold level of the indicator.

POL (ex-MATIC) Price Prediction: POL/USDT Seems to Have Bullish Potentials

Price activity in the POL (ex-MATIC) market has been mostly below the $0.600 price level in recent times. However, more recently, this price action has fallen below the 100-day MA line. Therefore, it implies that price action is now below all the MA lines on the chart.

However, this is just above the floor of the drawn symmetrical pattern on the chart. Also, the Stochastic RSI lines converge toward a bullish crossover in the oversold region. Technically, this hints at a potential breakout, which may be bullish in this market. This may cause price action to break through the next psychological resistance.

POL (ex-MATIC) Price Prediction: POL/USDT Bullish Breakout Looks Doubtful (4-Hour Chart)

By extending this market analysis to a 4-hour price chart, one can see that price action remains below all the MA lines on the chart. This poses a significant threat to the anticipated bullish breakout. The last price candle on the chart is red and quite small but suggests that bears are in the lead. The Stochastic RSI lines are also in the overbought region with the lead line pointed slightly toward the 80 level of the indicator.

POL (ex-MATIC) Price Prediction: POL/USDT Market May See a Bullish Breakout Soon

However, price activity can be seen respecting the floor of the drawn symmetrical triangle pattern as more recently appearing price candles continue to hover around the 20-day MA line. While bullish activity may seem latent, this might be an opportunity to get in early for at least short-term gains toward the $0.5000 price level.

Get POL (ex-MATIC) here. Buy POL

$SPONGE (SPONGE/USD) Teeters on the Brink: Is a Breakout Imminent?

The SPONGE/USD market has been a rollercoaster ride lately, with bulls and bears locked in a fierce struggle. This tug-of-war has created a volatile environment, sending prices swinging wildly. The bears initially gained the upper hand, pushing prices below the crucial $0.000025 support level. This downward pressure dragged the price down to approximately $0.000023.

However, the bears appear to be running out of steam. The market has entered a period of indecision at the $0.000023 level, characterized by the emergence of consecutive doji candlesticks. These indecisive candlesticks suggest a potential shift in momentum. The selling pressure may be waning, and buyers could be preparing to stage a comeback.

This battleground at $0.000023 could be a pivotal moment for SPONGE/USD. Will the bears maintain their grip, or will the bulls break free and propel prices higher?

Key Market Dynamics:

  • Resistance Levels: $0.00005, $0.000055, $0.000060
  • Support Levels: $0.000020, $0.0000195, $0.000019

$SPONGE (SPONGE/USD) Teeters on the Brink: Is a Breakout Imminent?

$SPONGE (SPONGE/USD) Technical Analysis

Our previous analysis identified the $0.000025 level as a critical support point. However, the recent bearish onslaught has shifted this support level to approximately $0.000023. At this new support level, the market has entered a state of limbo, with three consecutive doji candlesticks painting a picture of indecision. This crypto pattern often signals a pause in the bearish momentum, indicating potential exhaustion among sellers.

This crossroads presents a critical juncture. Will $SPONGE break below the new support level and continue its downward spiral, or will buyers emerge victorious and initiate a bullish reversal?

$SPONGE (SPONGE/USD) Teeters on the Brink: Is a Breakout Imminent?

$SPONGE (SPONGE/USD) 1-Hour Chart Observations

Despite the recent bearish pressure, the price has shown resilience at $0.000023. This unexpected strength could be a sign that a bullish rebound is brewing.

The Moving Average Convergence Divergence (MACD) indicator seems to support this notion. The bearish histograms are shrinking, suggesting waning bearish momentum. Furthermore, the MACD lines are approaching a bullish crossover, a signal that often precedes a shift towards bullish momentum.

Adding to the bullish narrative, the Bollinger Bands are gradually converging, indicating a decrease in volatility. This convergence often precedes a significant price move, further increasing the likelihood of a potential rebound.

Buy $SPONGE!

Join the SPONGE community and be part of the next big crypto sensation! Buy Sponge ($SPONGE) today!

$SPONGE (SPONGE/USD) Set to Soar: Anticipating a Breakout from the $0.000023 Level

The $SPONGE market has experienced a bearish onslaught over the past few days. The recent tug-of-war between bullish and bearish forces has led to heightened market volatility, resulting in erratic price swings. Despite this volatility, the bears managed to capitalize on the situation, driving the price below the critical support level at $0.000025. This downward momentum has brought the price to approximately $0.000023.

However, the bearish pressure seems to have met strong resistance at the $0.000023 level. Over the past three trading sessions, the market has entered a period of indecision, marked by the appearance of consecutive doji candlesticks. This stalemate suggests that selling momentum may be waning, and a bounce in the $SPONGE market could be on the horizon.

The formation of dojis at this key level signals a potential turning point, offering hope for a recovery as buyers begin to reenter the market. The current setup provides an optimistic outlook for a possible upward move in the near future.

Key Market Dynamics:

  • Resistance Levels: $0.00005, $0.000055, $0.000060
  • Support Levels: $0.000020, $0.0000195, $0.000019

$SPONGE (SPONGE/USD) Set to Soar: Anticipating a Breakout from the $0.000023 Level

$SPONGE (SPONGE/USD) Technical Analysis

In today’s $SPONGE market, the price has fallen below the $0.000025 support level, which was identified in the previous analysis as a potential relaunch point. However, due to recent bearish activity, this support level has shifted downward to approximately $0.000023.

At this new support level, the market has entered a phase of indecision, as evidenced by three consecutive doji candlesticks. This pattern typically reflects a standstill in market momentum following a bearish move that drove the price to a lower level. The appearance of these dojis suggests that sellers may be experiencing exhaustion, while buyers are beginning to counterbalance the downward pressure, creating a stalemate at the new support level.

This situation highlights a critical juncture for the crypto signal, where further developments could indicate either a reversal or continuation of the prevailing trend.

$SPONGE (SPONGE/USD) Set to Soar: Anticipating a Breakout from the $0.000023 Level

$SPONGE (SPONGE/USD) 1-Hour Chart Observations

Despite the bearish pressure that has driven the market to a lower price level, the price has remained steady at $0.000023, showing resilience. This stability could indicate that the market is gearing up for a potential bounce.

The Moving Average Convergence and Divergence (MACD) indicator supports this outlook. The bearish histograms show a clear and progressive decline in momentum, signaling weakening bearish strength. Additionally, the MACD lines are nearing a bullish crossover, a development that often signals the onset of bullish momentum.

Further supporting this possibility, the Bollinger Bands are gradually converging, indicating reduced volatility and the potential for a significant price move. These combined factors suggest that a rebound may be on the horizon.

Buy SPONGE/USD!

Join the SPONGE community and be part of the next big crypto sensation! Buy Sponge ($SPONGE) today!

Philippine Banks Collaborate for Inclusive Stablecoin Solutions

Philippine banks are coming together to establish PHPX. This coin is aimed at improving international payments and financial inclusion through the Hedera decentralized ledger technology (DLT) network. However, the release date has been set to be between May and July.

Major banks like UnionBank, RCBC, Cantilan Bank, and Rural Bank of Guinobatan are participating in the project and governing the coin collaboratively.

Additionally, PHPX aims to enable real-time payments so that Filipinos living overseas can send money or settle invoices right away.

With $40 billion being sent by foreign workers in 2024, the program seeks to streamline remittances, a vital component of the Philippine economy.

To this end, this initiative reveals the Philippine bank’s actions toward addressing economic issues, establishing accessible financial system through technology.

Streamlining Cross-Border Payments Through Stablecoin

The goal of PHPX Stablecoin is to reduce the cost and speed of international money transactions. To this proposed development, UBX CEO John Januszczak has emphasized that PHPX will support payments for needs like tuition fees in real-time, no matter where the sender is located.

Philippine Banks Collaborate for Inclusive Stablecoin Solutions

To enable smooth cross-border payments, PHPX will offer a multicurrency stablecoin exchange. Users can convert PHPX to stablecoins in US dollars, Singapore dollars, and Japanese yen. Liquidity providers and investors may also join to manage the supply of PHPX and meet market demand. This ensures flexibility for users and broadens the token’s use cases.

Promoting Financial Inclusion

By collaborating with rural and urban banks, PHPX ensures its services reach underserved communities. This helps low-income Filipinos access reliable and affordable financial tools. However, the Hedera DLT network will help in terms of security, and permission design guarantees compliance with global financial regulations, increasing trust in the system.

The stablecoin could also expand to retail payments and point-of-sale transactions, further driving financial inclusion. Its adherence to international standards, like the Basel Committee guidelines and the EU’s Markets in Crypto-Assets Regulation, positions PHPX as a low-risk, compliant digital asset for broader adoption.

The PHPX stablecoin represents a major step toward inclusive and efficient financial solutions in the Philippines. By addressing remittance challenges, the coin promotes faster payments and financial access with its compliance-focused approach and potential for growth.


In order to place winning trades with us via Bybit, you can open an account here.