Ethereum (ETH/USD) Sees Stronger Bearish Pressure; Seeks to Break Above $3,300

Ethereum Long-term Analysis: Bearish

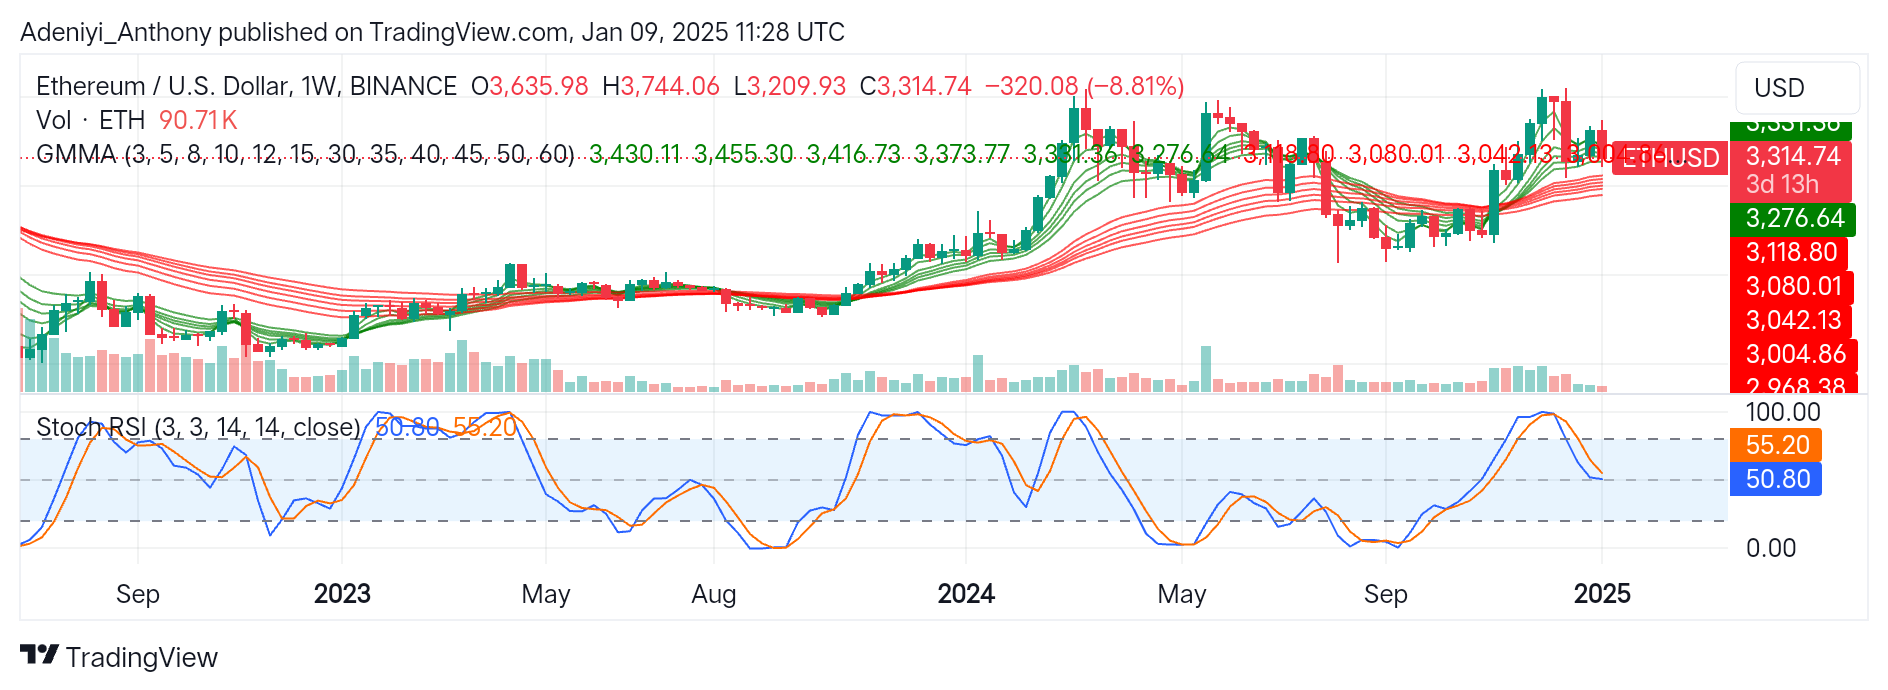
Ethereum against the United States Dollar is experiencing short-term bearish momentum as price dips significantly after opening at $3,635.98 for the week. The pair has faced strong selling pressure after briefly touching $3,744.06, struggling to maintain upward momentum.

This reflects ongoing market uncertainty as the Guppy Multiple Moving Averages (GMMAs) and the Stochastic RSI suggest caution. Though the market cools off for now, further downtrend is possible if the current support level fails. To this end, traders might look for confirmation of support or breakdown before making rational decisions.

Currently, Ethereum trades at $3,314.74, after seeing a decrease of 8.81% for the week.

Ethereum (ETH/USD) Sees Stronger Bearish Pressure; Seeks to Break Above $3,300
ETHUSDT-Weekly Chart

Technical Indicators

Major Resistance Levels: $3,430.11, $3,455.30, and $3,476.73

Major Support Levels: $3,118.80, $3,080.01, and $3,042.13

Ethereum Technical Analysis

The weekly analysis of Ethereum against the USD shows that the pair has been having difficulty maintaining upside momentum as the pair keeps breaking below short-term EMAs. However, as the gap between the Sets of EMAs narrows, ETH/USD moves near another support line, suggesting sellers’ pressure on the pair.

On the other hand, the Stochastic RSI shows that the pair operates in the neutral zone, with both lines reading points within the 50-mark range. However, the current positioning of the lines suggests an impending crossover to either. Therefore, a sustained momentum above the current level would indicate the possibility of a reversal; otherwise, a fall below $3,118.80 would suggest more dip to the south.

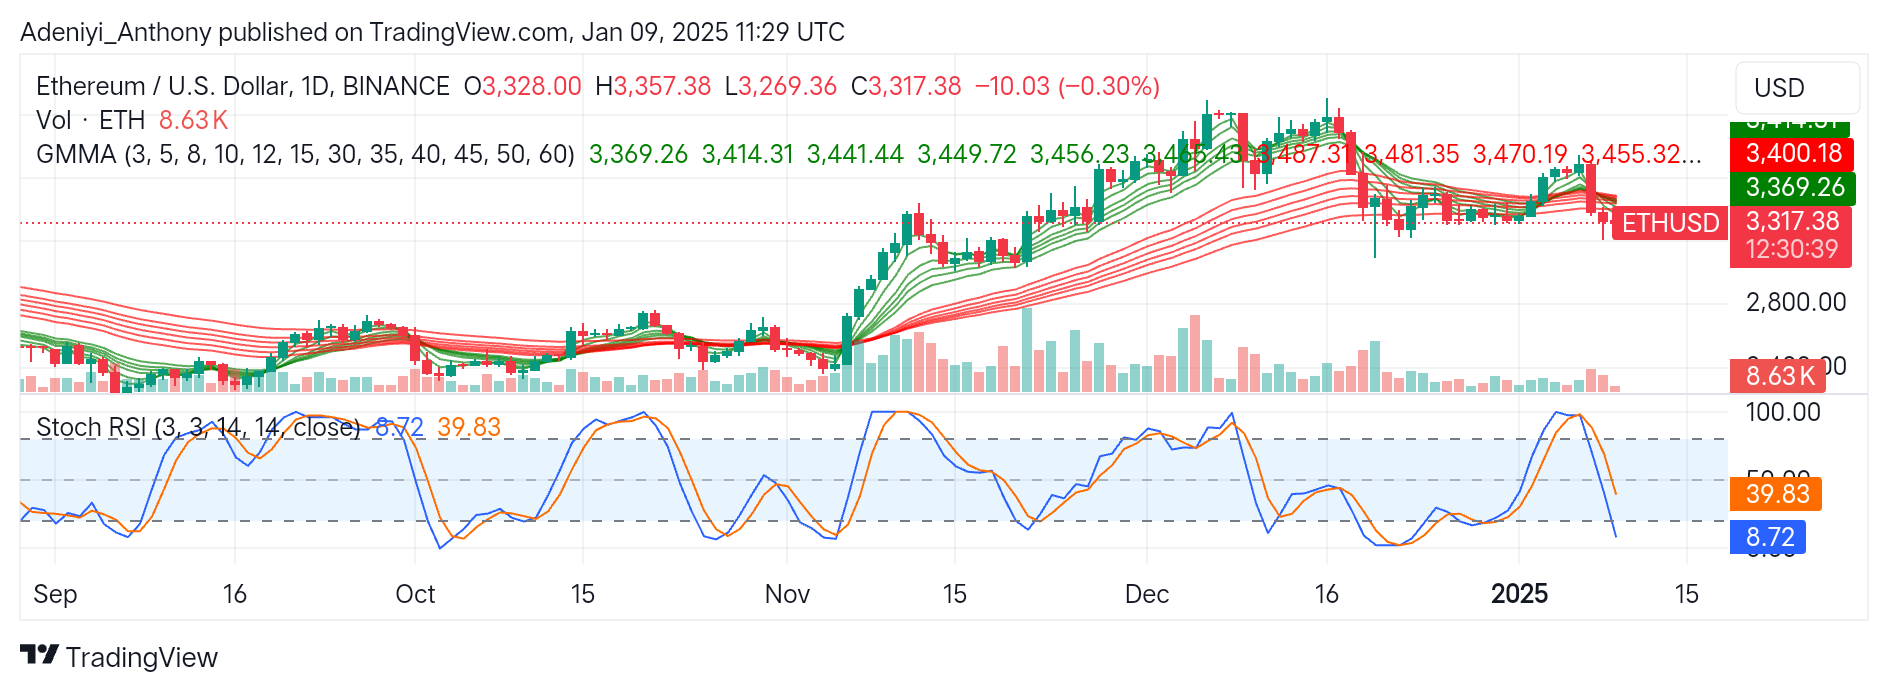
ETH/USD Analysis: Will the $3,118 Level Hold?

On the daily timeframe, ETH/USD is slightly down by a marginal 0.30%, this indicates minor bearish momentum with little volatility for the day. However, as the EMAs converge together, signaling a reduced momentum price may head south towards $3,188; otherwise, stronger bullish participation would indicate recovery toward $3,369.36.

On the other hand, the oscillator at the bottom of the chart suggests an oversold condition for the pair. This is an indication that ETH/USD acts under the influence of strong selling pressure. However, it may also suggest a potential reversal in the near term due to exhaustion.

Therefore, an increased volume with upward curvature of the lines would suggest a weak bullish momentum; otherwise, suspension of the lines at current levels would suggest further decline.

Ethereum (ETH/USD) Sees Stronger Bearish Pressure; Seeks to Break Above $3,300
ETHUSDT-Daily Chart


You can purchase crypto coins here. Buy LBlock

ZKsync (ZK/USD) Bearish Trader Extends Price Towards $0.17026

The market for ZKsync against the United States dollar has been experiencing heightened volatility recently. This is seen in the three-day continuous downtrend, as depicted by the chart. However, despite price movement towards the lower Bollinger band, with the Stochastic RSI hinting at strong selling pressure, the oversold condition suggests exhaustion with potential reversal in the near term.

To this end, the price actions around $0.17026 would determine the next action as ZK/USD goes on a downside trajectory.

Currently, ZKsync is trading at $0.18122 after declining by 3.47% from the previous session.

ZKsync (ZK/USD) Bearish Trader Extends Price Towards $0.17026
ZKUSDT-Daily Chart

Technical Indicators

Major Resistance Levels: $0.19000, $0.19749, and $0.22472

Major Support Levels: $0.17026, $0.17000, and $0.16000

Zksync Technical Analysis

The analysis of ZKsync against the USD shows that the pair is hovering near a critical support level, as it shows signs of consolidation. Though the bearish traders dominate the market in the short term, the oversold conditions by the technical indicators on the chart could trigger a relief rally towards $0.19000 in the near term.

To this end, a decisive break above $0.19000, a point closer to the mid-band, would signal a bullish momentum. Conversely, a maintained line position of the Stochastic oscillator with a break below the lower band would indicate further downside movement.

ZK/USD Analysis: What to Expect

On the 4H timeframe, ZK/USD is trading near the lower Bollinger band at $0.18122 with a slight increase of 0.48%. However, as the intertwined lines of the oscillator on the chart suggest prolonged range-bound activities, a spike in the trading volume would indicate Zksync’s directional move.

To this end, the pair could rebound towards the mid-band level if the price breaks above $0.19000, aiming at $0.20403; otherwise, if the price fails to hold above $0.17096, it could further drop to test lower levels.

ZKsync (ZK/USD) Bearish Trader Extends Price Towards $0.17026
ZKUSD-4H Chart


You can purchase crypto coins here. Buy LBlock

Tamadoge (TAMA/USD): Demand vs. Supply Below $0.001 – A Potential Dip-Buying Opportunity?

The ongoing battle between TAMA/USD buyers and sellers has intensified following a plunge below the critical $0.001 support level. On January 5th, the bears took control, driving prices further downward. After reaching a low of $0.000857, the bulls managed to find solid footing, temporarily halting the sharp decline.

Despite this brief stabilization, the struggle continues, with bears seemingly maintaining the upper hand. The crypto signal has gradually slid to $0.000083, with bears pushing toward the $0.0008 threshold. There is potential for the bulls to regroup at this level, possibly triggering a breakout and reversing the bearish momentum.

Key Levels

  • Resistance: $0.0018, $0.0019, and $0.0020
  • Support: $0.001, $0.0009 and $0.0008

Tamadoge (TAMA/USD): Demand vs. Supply Below $0.001 – A Potential Dip-Buying Opportunity?

TAMA/USD Price Analysis: The Indicators’ Point of View

Although the TAMA/USD bears have managed to push the market below the previous support level of $0.000857, driving it down to the current price of $0.000083, the candlestick patterns suggest waning bearish momentum. The candlesticks feature smaller bodies, closely resembling dojis, which often indicate indecision in the market.

While the bears successfully breached the $0.000857 support, their struggle near the $0.0008 price level suggests the presence of a strong bullish bias in this zone. Notably, the current trading session has formed a four-price doji, a potential indication that the bearish trend may be reaching its peak at $0.000083.

If this interpretation holds, a rebound or bounce from this level could be imminent, signaling a potential shift in market direction.

Tamadoge (TAMA/USD): Demand vs. Supply Below $0.001 – A Potential Dip-Buying Opportunity?

Tamadoge Short-Term Outlook: 1-Hour Chart

A closer look at a smaller timeframe reveals a flatter market, accompanied by the convergence of the Bollinger Bands around this price action. This phenomenon suggests that the market may be consolidating in preparation for a potential bounce, as the bearish trend appears to have encountered significant resistance near the $0.0008 price level.

Traders may find this level worth considering for investment, but only after confirming clear signs of a rebound. If a rebound does occur at this point, the market could potentially aim for the $0.001 price level as its next target.

Buy Tamadoge!

Buy TAMA today!

Kyber Network (KNC/USD) Confirms Bullish Momentum with a Bounce from $0.55

The Kyber Network is currently attempting to regain bullish momentum after finding pivotal support at the $0.45 level. The price action has shown minor upward shifts from recent lows, indicating a gradual recovery.

The ongoing price movement suggests that the bulls are steadily breaking through key bearish resistance levels, achieving incremental gains in price.

Before the emergence of the current bullish trend, the market experienced a strong bearish phase. This downturn followed a significant bull run that began in early November and peaked in early December of last year. The previous bearish trend led to increased market volatility, which partially explains the measured pace of the ongoing bullish recovery.

Kyber Network Market Data

  • KNC/USD Price Now: $0.62
  • KNC/USD Market Cap: $116.3 million
  • KNC/USD Circulating Supply: 186.6 million KNC
  • KNC/USD Total Supply: 239.6 million KNC
  • KNC/USD CoinMarketCap Ranking: #427

Kyber Network (KNC/USD) Confirms Bullish Momentum with a Bounce from $0.55

Key Levels

  • Resistance: $0.70, $0.75, and $0.80
  • Support: $0.55, $0.50, and $0.45.

Kyber Network Through the Lens of Indicators

The previous bearish run, which ended around the $0.45 price level on December 20, was notably strong and triggered heightened market volatility. However, the market’s ability to establish support at $0.45 underscores the strength of the bullish bias. This is evident in the consistent formation of slightly higher lows, indicating that bullish sentiment is gaining ground against bearish pressure.

Despite the apparent resilience of the bulls in this crypto signal, the key question remains: can they break the resistance at $0.645? This resistance level, established on January 6, has successfully repelled multiple bullish advances. The repeated rejection at this price point highlights the critical nature of this level for the continuation of the bullish trend.

A successful breakout above $0.645 would likely attract further bullish sentiment. However, the bears remain active at this resistance, as seen in today’s trading session. The bullish candlestick features a small upper shadow, reflecting persistent selling pressure at this level.

Additionally, discrepancies between price action and the trading volume histogram are notable. While the histogram indicates significant trading activity, today’s bullish candlestick appears weaker in comparison. The presence of a small upper wick on the candlestick further suggests resistance at $0.645.

For the bullish momentum to continue, breaking through this resistance level is crucial. Until then, the Kyber Network market remains at a pivotal juncture.

Kyber Network (KNC/USD) Confirms Bullish Momentum with a Bounce from $0.55

KNC/USD Price Prediction: 4-Hour Chart Analysis

A closer examination of the 4-hour chart for the Kyber Network market reveals promising signs that a breakout above the critical $0.645 resistance level could be imminent. This optimism is supported by the consistent formation of higher lows visible within this timeframe, signaling sustained bullish momentum.

However, the repeated rejection of price at this resistance level indicates strong bearish presence, suggesting that the market faces significant headwinds at this critical point.

If a breakout fails to materialize, the market may consolidate around the $0.60 price level. Such consolidation could stabilize the price and provide a foundation for a potential continuation of the ongoing bullish trend.

Trade crypto coins on BYBIT!

Bitcoin Market Experiences Sharp Correction as Fed Policy Concerns Mount

Bitcoin dropped below $93,000 on January 8, marking a significant correction from its recent peak above $102,000. The world’s largest cryptocurrency saw a $5,000 decline in a single day, primarily driven by growing uncertainty around U.S. Federal Reserve monetary policy.

Market data shows that Bitcoin briefly touched the $102,700 mark on January 7 before falling to $92,500, reflecting increased selling pressure from traders concerned about potential interest rate changes. The sudden price movement resulted in over $900 million worth of leveraged long positions being liquidated within 48 hours.

Bitcoin Market Experiences Sharp Correction as Fed Policy Concerns Mount
Image via Coinglass

Federal Reserve Policy Impact on Bitcoin

Ryan Lee, chief analyst at Bitget Research, explained the price movement to Cointelegraph, saying: “Strong U.S. economic indicators are pointing to possible interest rate hikes, making cryptocurrency investments less appealing right now. The Fed’s hints at tighter monetary policy are adding to market corrections.”

Current market forecasts suggest the Federal Reserve might delay its first interest rate cut until June 18, according to CME Group’s FedWatch tool. For the upcoming January 29 Fed meeting, markets are pricing in a 95% chance that rates will stay unchanged.

Bitcoin Market Experiences Sharp Correction as Fed Policy Concerns Mount
Image via FedWatch Tool

Trading experts point to $95,000 as a crucial short-term level for Bitcoin. Data from top exchanges shows significant buy orders clustered around the $88,000-$92,000 range, suggesting strong support at these levels.

Market Analysis and Future Outlook

John Glover, chief investment officer at Ledn and former Barclays managing director, offers a technical perspective: “We might test the $90,000 level again before seeing the next major upward move. Based on wave analysis patterns, we’re likely completing the fourth wave, suggesting a potential rally toward $126,000-$128,000 after this consolidation period.”

Despite the current downturn, several positive indicators support Bitcoin’s long-term outlook. CryptoQuant CEO Ki Young Ju highlights strong underlying demand based on the platform’s Apparent Demand indicator, which measures the relationship between mined Bitcoin and coins held for at least one year.

Bitcoin Market Experiences Sharp Correction as Fed Policy Concerns Mount
Image via X

Looking ahead, market analysts remain optimistic about Bitcoin’s trajectory through 2025. Some forecasts suggest a potential cycle peak above $150,000 later this year, supported by predictions of a $20 trillion increase in global money supply that could attract $2 trillion in Bitcoin investments.

For traders and investors, the key support level to watch is $91,000. Popular crypto analyst Rekt Capital notes that Bitcoin has returned to trading within the $91,000-$101,165 range after failing to maintain higher levels.

The current market correction comes during a period of relatively low liquidity following the holiday season. Traders should pay close attention to spot market flows and exchange order books, as these factors will likely play crucial roles in determining Bitcoin’s price direction in the coming weeks.

This price action serves as a reminder that despite Bitcoin’s overall upward trend, the cryptocurrency market remains highly sensitive to macroeconomic factors, particularly U.S. monetary policy decisions. Investors should maintain appropriate risk management strategies while monitoring key support levels and market indicators.

What to Expect with Bitcoin Moving Forward 

As mentioned earlier, BTC is downward-bound, possibly revisiting the $89,000 mark after about two months. At the moment, however, the $95,000 support mark is active as a strong cradle for the benchmark cryptocurrency and preventing a sharp drop descent to level targets.

Bitcoin Market Experiences Sharp Correction as Fed Policy Concerns Mount
BTC/USDT Daily Chart

That said, this support property is only expected to last a short while, so traders can expect to see the persistence of notable price dips in the next few days or weeks.

BTC Statistics Data

BTC Current Price: $94,500

BTC Market Cap: $1.88T

BTC Circulating Supply: 19.8M

BTC Total Supply: 21M

BTC Market Ranking: #1

Interested in learning how to day trade crypto? Get all the information you need here

Uniswap Price Prediction: UNI/USDT May Fall Through the $12.74 Support

Uniswap Price Prediction (January 9):

The Uniswap market has been quite volatile recently. This has made it a bit challenging to determine price directions. The market is currently heading south in what seems like a very strong downward retracement.

UNI/USDT Long-Term Trend: Bullish (Daily Chart)

Key Price Levels:

Resistance: $14.00, $16.00, $18.00

Support: $12.00, $10.00, $8.00

However, the last price candle here has appeared smaller than the previous ones. Nevertheless, the token’s price action stays above the support at the $12.74 threshold level. Also, trading in this market now occurs below the crossed 20- and 50-day MA lines. Meanwhile, the Stochastic Relative Strength Index (RSI) lines have fallen very sharply and deeply into the oversold region.

Uniswap Price Prediction: UNI/USDT Bears Reign May Be Breached at the $12.74 Threshold

Although recent price activity in the Uniswap daily market is bearish, one thing is for sure. It could be seen that the downward retracement in the market seems to be losing steam as we approach the $12.74 price level. This could be seen through the appearance of the last price candle on the chart.

This suggests that the downward retracement may be breached at the mentioned support level if it holds. However, the Stochastic RSI lines seem to hint at the fact that buyers aren’t putting in much effort toward breaching the price decline here. Therefore, this calls for a much closer examination.

Uniswap Price Prediction: UNI/USDT Buyers Look Overwhelmed (4-Hour Chart)

In the Uniswap 4-hour market, price action continues to hover above the support at $12.74. Lately, price candles on the chart seem quite small and, as such, portray a reducing bearish momentum as earlier stated. However, here, price action lies below all the MA lines on the chart. Interestingly, the market had rebounded off the mentioned technical support during the past two sessions.

Uniswap Price Prediction: UNI/USDT May Fall Through the $12.74 Support

This has kept the market above the $12.74 support level despite subsequent minimal downward retracements. As a result, the Stochastic RSI lines now have an upward trajectory. Consequently, indications here suggest that the support may hold. However, the position of price action below all the MA lines suggests that the market may fall towards the $12.00 mark.

Get Uniswap here. Buy UNI

Dash 2 Trade Price Predictions for Today, January 9: D2TUSD Price Jumps above the $0.00113 Resistance Level

Dash 2 Trade Price Forecast: D2TUSD Price Jumps above the $0.00113 Resistance Level (January 9)

D2TUSD’s price jumps above the $0.00113 resistance level and remains pressured even as the sentiment in the crypto market improves, with Bitcoin sitting above $100k. The coin is currently trying hard not to fall by resisting sellers. In case the bulls sustain bullish pressure and break up the resistance level of $0.00430, the coin price may increase further to a $0.01000 high trend line, offering a key entry for confidence.

Key Levels:
Resistance levels: $0.00120, $0.00125, $0.00130
Support levels: $0.00107, $0.00106, $0.00105

D2T (USD) Long-term Trend: Bullish (Daily Chart)

Dash 2 Trade remains in a bullish trend in its long-term outlook. The coin price is slightly above the moving average, indicating an uptrend. However, the token may firmly maintain its bullish trajectory, with a significant opportunity for bullish continuation.
Dash 2 Trade Price Predictions for Today, January 9: D2TUSD Price Jumps above the $0.00113 Resistance Level
The bulls were able to push the D2TUSD to the $0.00113 resistance value in the last session and have enhanced the crypto price to stay above the supply trend levels in its recent high.

The coin price finds reliable resistance at around $0.00125 above the EMA-50, resulting in intraday gains and encouraging additional buying activity. Hence, staying above the resistance trend lines indicates a strong possibility for a bullish correction.

Thus, if the bulls breach the $0.00430 resistance, the next resistance level to watch out for would be around the $0.00800 level, bolstering confidence in the token’s upward movement.

Additionally, the daily stochastic remain in an uptrend, showing the continuation of bullish sentiment. Hence a successful breakout could propel the Dash 2 Trade price towards the $0.01000 upper resistance in the days ahead, providing traders with a significant opportunity for bullish continuation in its long-term outlook.

D2T (USD) Medium-term Trend: Bullish (4H Chart)

Despite the interference of short-term traders in the price flow, the medium-term time frame market shows a bullish race.
Dash 2 Trade Price Predictions for Today, January 9: D2TUSD Price Jumps above the $0.00113 Resistance Level
The Dash 2 Trade price is moving towards the upper resistance above the converging trend lines, denoting a bullish trend and a rise in volatility. Thus, buyers are currently gaining more strength in the market.

The bulls’ pressure on the coin to the $0.00113 supply value during the last session has sustained the coin price above the resistance trend levels in its recent high.

Today’s 4-hourly bullish candle at $0.00135 which further rises to a $0.00135 supply mark above the moving average, confirms the bulls’ dominance in the market, gaining attention among market traders.

Meanwhile, if the bullish momentum continues, the D2TUSD price could reach its all-time high of $0.00265, reflecting growing investors’ interest and momentum.

However, there is a possibility of a further increase in the price of Dash 2 Trade if the buy traders should increase their price actions and all the current support level holds, a psychological key level at the $0.01000 upper supply level might be reached in few days in its medium-term time frame.

Learn about Crypto Bundles for Dash 2 Trade! Crypto Bundles are the ideal tool for long-term buy-and-hold investments by passive investors, eliminating the need for guesswork.

📢 Discover Dash 2 Trade Crypto Bundles! 🌟


Take the guesswork out of investing with Crypto Bundles – the perfect tool for passive investors to buy-and-hold for the long term.

💎 Top 3 Bundle
Top 3 largest coins by market cap: BTC, SOL, ETH
📈 Average Annualized Return: 186%… pic.twitter.com/CnHingymi4

— Dash 2 Trade (@dash2_trade) January 7, 2025

Want a coin that has a huge potential for massive returns? That coin is Dash 2 Trade. Buy D2T now.

$SPONGE (SPONGE/USD) Presents Another Opportunity for Traders To Buy the Dip

The $SPONGE market recently exhibited a significant surge, breaking out of its established trading range around $0.00003 and overcoming the formidable $0.00004 resistance level. However, upon reaching $0.00005, the pair encountered strong selling pressure, resulting in a sharp price rejection. This event underscores the heightened market volatility triggered by the rejection at the $0.00005 level.

Traders are currently observing a price retracement to around $0.000025, below the critical $0.00003 support level. While this price action may appear discouraging in the short term, it presents a potential opportunity for investors to accumulate SPONGE at a more favorable entry point. A subsequent rebound from these lower levels could signal renewed bullish momentum.

Key Market Dynamics:

  • Resistance Levels: $0.00005, $0.000055, $0.000060
  • Support Levels: $0.000020, $0.0000195, $0.000019

$SPONGE (SPONGE/USD) Presents Another Opportunity for Traders To Buy the Dip

$SPONGE (SPONGE/USD) Technical Analysis

Following the failure of $SPONGE bulls to maintain prices above the $0.00004 level, bears capitalized on the market’s volatility, driving prices below the critical $0.000026 support level. This decline, however, did not reach the previous low of $0.0000006, indicating some resilience on the part of the bulls.

Despite the presence of a bearish Marubozu candlestick and a strong bearish histogram on the chart, the crypto signal remains relatively stable around $0.000025. This suggests that buying pressure may be emerging at these levels, potentially leading to a breakout above the $0.00004 resistance level.

$SPONGE (SPONGE/USD) Presents Another Opportunity for Traders To Buy the Dip

$SPONGE (SPONGE/USD) 1-Hour Chart Observations

The Relative Strength Index (RSI) exhibits significant oscillations, reflecting the market’s momentum and volatility. A sharp decline in the RSI, particularly as it approaches the 30 level, may indicate an oversold condition and potentially foreshadow a market rebound. This assessment is further supported by recent historical price behavior.

Buy SPONGE/USD!

Join the SPONGE community and be part of the next big crypto sensation! Buy Sponge ($SPONGE) today!

ApeCoin (APE/USD) Resumes Bullish Trend

Price Analysis: APEUSD Has Resumed its Bullish Trend After the Bearish Momentum Subsided

The APE/USD market has resumed its bullish trajectory following the conclusion of a bearish retracement phase. The initial bullish trend originated at the $0.460 level, marked by the formation of a reverse head-and-shoulders pattern. This pattern set the stage for a significant upward movement in price.

APEUSD Key Levels

Demand Levels: $0.880, $0.460
Supply Levels:$1.360, $1.970

ApeCoin (APE/USD) Resumes Bullish Trend

The first notable bullish breakout occurred when the price decisively breached the $1.360 supply zone, establishing a strong bullish bias. This breakthrough underscored the momentum shift in favor of buyers. However, after surpassing $1.360, the market entered a bearish retracement, finding support at the $0.880 level. This level now serves as a critical low for the ongoing bullish structure.

The bullish momentum regained strength after the retracement, culminating in another bullish break of structure. Despite this, the price encountered resistance at $1.970, triggering another bearish retracement. This decline, however, is regarded as a corrective move within the broader bullish framework. The price dipped to the $1.360 level, which acted as a significant support zone, enabling the resumption of the bullish trend.

On the daily timeframe, the Moving Average indicates a bullish signal, as the price remains above the indicator. The 4-hour chart further confirms this bullish shift in market structure, signaling a buildup in momentum as the price approaches the $1.360 level once more. However, the 4-hour Relative Strength Index (RSI) reveals a temporary bearish pullback from the overbought region, suggesting a brief pause before another potential upward surge.

ApeCoin (APE/USD) Resumes Bullish Trend

Market Expectation

The 4-hour trend is expected to activate the order block and breach the $1.360 level, paving the way for further upside. Once $1.360 is decisively broken, the next target lies at the $1.970 resistance level, marking a significant milestone in the ongoing bullish trend.

You can purchase Lucky Block here.  Buy LBLOCK

Note: Cryptosignals.org is not a financial advisor. Do your research before investing your funds in any financial asset or presented product or event. We are not responsible for your investing results