Litecoin (LTC/USD) Market Loses Stances, Exchanging Below $75

Litecoin Price Prediction – February 20

Variant price reactions have staged between bulls and bears to the extent of making the LTC/USD market lose slightly in their recent rising forces, exchanging below the point of $75 as of this write-up.

The middle Bollinger Band trend line has been surrounded by a series of fictitious swing low actions, which are intended to be used as a testing support stance for purchasers hoping to quickly recover. In the worst-case scenario, the market may risk falling back to the point of $65. And the value appears to serve as the key line against witnessing consistent negative breakthroughs. As things stand, long-term investors continue to have a fantastic opportunity to maintain appreciation trends.

LTC/USD Market
Key Levels:
Resistance levels: $75, $80, $85
Support levels:$65, $60, $55

LTC/USD – Daily Chart
The LTC/USD daily chart reveals that the crypto market loses slightly, exchanging below the resistance line of $75.

The stochastic oscillators have been placed briefly southerly in the oversold region, denoting that a falling force is ongoing. And a bearish candlestick is surfacing to serve as evidence of the situational posture of the indicators. The Bollinger Band trend lines are placed to systemically remain around the lines of $75 and $65, showcasing that range-bound spots are equally playing along in the market.
Litecoin (LTC/USD) Market Loses Stances, Exchanging Below $75

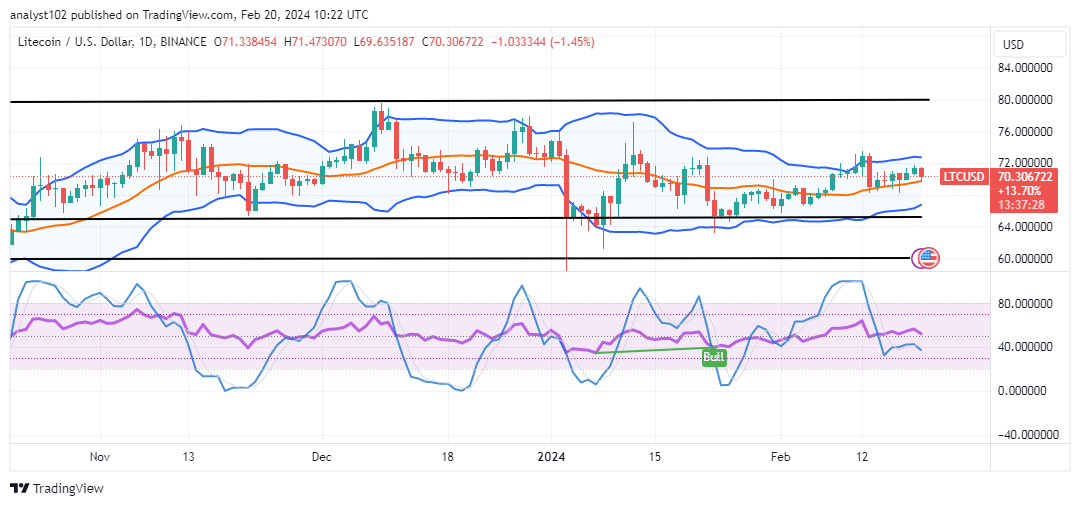
As the LTC/USD market trades near $70, should sellers play along with any falling force intended around the middle Bollinger Band?

As there has been a bearish candlestick in the making, sellers need to be wary of a rallying motion to surpass the higher end of the stick, as the LTC/USD market is losing slightly, exchanging below the line of $75.

As it has been projected, the current brief retracement is likely going to give in to a rebound from a low zone beneath the middle Bollinger Band. In the event that that presumption tends to materialize with active motions, the resistance line of $75 will be broken northwardly because it will be the second term of making waves into a bullish trend.

Bears need to be wary of pushing for a fresh order while it is indicated by the stochastic oscillators that an oversold condition has been reached. Therefore, executing a shorting order may, in the first place, lack the action to cover up for the spread volume that brokers will deduct. Meanwhile, the point of $75 should not be breached by buyers to let selling activities thrive.
Litecoin (LTC/USD) Market Loses Stances, Exchanging Below $75
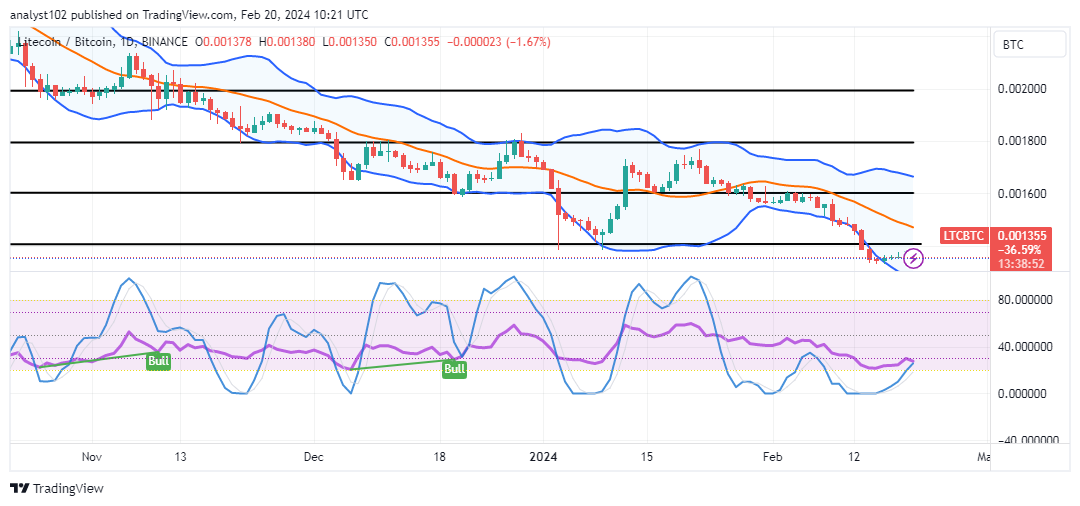
LTC/BTC Price Analysis
In contrast, Litecoin is still taking a losing stance against the market value of Bitcoin, exchanging below the middle Bollinger Band’s point.

Smaller candlesticks have been appearing away from the bottom Bollinger Band indicator line in a sequence, suggesting that a baseline is essentially developing. Stochastic oscillators are trying to move back to the north side while they are in the oversold area. It demonstrates how the base instrument is accumulating momentum in order to terminate some lines of reduction.

Note: Cryptosignals.org is not a financial advisor. Do your research before investing your funds in any financial asset or presented product or event. We are not responsible for your investing results.


You can purchase Lucky Block here. Buy LBLOCK

Chainlink Falters as It Battles to Stay above $19.00

Chainlink (LINK) Long-Term Analysis: Bullish
Chainlink’s (LINK) price is trading above the moving average lines as it battles to stay above $19.0.00. The current uptrend has been interrupted, as it reached a high of $20.90 on February 11, 2024. The altcoin is retracing to the moving average lines. On the downside, if the altcoin retraces and remains above the 21-day SMA or the $19 support level, the present uptrend is likely to persist.

The altcoin will rise and revisit its prior high of $21. The present rise, however, may come to a stop if the price falls below the 21-day moving average. The slide will continue to a low above the 50-day SMA or $16.00 support. Meanwhile, the altcoin continues to trade above the moving averages.

Chainlink Falters as It Battles to Stay above $19.00
LINK/USD – Daily Chart

Technical indicators:
Major Resistance Levels – $8.00, $10.00, $12.00
Major Support Levels – $6.00, $4.00, $2.00

Chainlink (LINK) Indicator Analysis
Chainlink has retraced above the moving averages. The altcoin will gain if the price bars stay above the moving average lines. The moving average lines on the 4-hour chart are sloping horizontally as a result of the uptrend’s termination. On the daily chart, the moving average lines are sloping upward, indicating a previous rally.

What Is the Next Direction for Chainlink (LINK)?
Chainlink’s 4-hour chart shows a sideways trend as it battles to stay above $19.00. The dominance of the Doji candlesticks has kept the price movement motionless. The altcoin will trend once the present support and resistance levels are broken. Meanwhile, the crypto signal is fluctuating as the rally has come to an end.

Chainlink Falters as It Battles to Stay above $19.00
LINK/USD – 4-Hour Chart


You can purchase Lucky Block here. Buy LBLOCK

Note: Cryptosignals.org is not a financial advisor. Do your research before investing your funds in any financial asset or presented product or event. We are not responsible for your investing result

$SPONGE (SPONGE/USD) Rides the Wave: Volatility Surge Unveils Bullish Potential

In a captivating twist, the SPONGE/USD market has embarked on an exhilarating journey, breaking free from its tight grip around the $0.000035 mark. The price bandwidth of the price swing extended to $0.0002 before it fell back to settle at $0.000046. This significant price movement within the past few days is a sign of an uptick in volatility, which the bullish side can use to their advantage to secure a higher support level. As a matter of fact, the market settling at the $0.000046 level is a minor shift in favor of the bulls. Hopefully, the market will soon begin moving upward significantly.

 Key Market Dynamics:

  • Resistance Levels: $0.0010, $0.0011, and $0.0012.
  • Support Levels: $0.000035, $0.000030, and $0.000025.

$SPONGE (SPONGE/USD) Rides the Wave: Volatility Surge Unveils Bullish Potential

In-Depth Technical Analysis for $SPONGE (SPONGE/USD)

Forecasts whisper of a bullish resurgence, echoing through the charts even before the market’s journey nears the pivotal $0.000035 threshold. A subtle shift in momentum, reflected in the dwindling bearish fervor, dances alongside the trade volume indicator, painting a picture of optimism. A crimson hammer candlestick emerged from the darkness of the charts from the last analysis, its fiery hue, belying its bullish intent, signaled the entry of bullish warriors from the depths of key support levels. However, this trend did not last as bulls, as at, the last daily session could not sustain the recovery. Although this SPONGE/USD bullish intervention was observed, the bears once again gained strength to drive the price downward. Nonetheless, bulls are once again stepping in at $0.000046. The price may once again rally from here.

$SPONGE (SPONGE/USD) Rides the Wave: Volatility Surge Unveils Bullish Potential

Insights from the 1-Hour Perspective:

Zooming into the hourly chart perspective reveals a whirlwind of volatility, swirling fiercely within the confines of the one-hour trading session. What appears to be a dragonfly doji, initially interpreted as a potential bullish signal, later transformed into a significant bearish candlestick. The sellers’ initial attempts to steer the market southward, which were initially thwarted, were later regained as buyers failed to sustain their momentum, and they recongregated around the $0.000046 level. Substantial bullish actions are anticipated from this point onward.

In this market’s saga, volatility is not merely a storm to weather but a beacon illuminating the path to untold possibilities, where every crest and trough holds the promise of adventure and opportunity.

Buy SPONGE/USD!

Invest in the hottest and best meme coin. Buy Sponge ($SPONGE) today!

Ethereum Soars Past $3,000 as Liquidations Pile

Ethereum has seen substantial gains over the past week, surging over $400 to break above the key $3,000 resistance level today for the first time since April 2022. While Bitcoin also increased to $53,000, a more robust and consequential surge, Ethereum has significantly outperformed the largest cryptocurrency this week.

That said, Ethereum’s price rise seems driven by hype around potential approval for spot Ethereum ETFs in the US. Analysts point to May as the most likely approval period for the novel investment instrument in the US.

Interestingly, this price action mirrors the exact sequence of events that happened in late 2023 and early this year, when anticipation around Bitcoin ETF approvals sent its price surging. As an active crypto trader and investor for a while now, I understand how positive regulatory developments can catalyze major rallies.

However, ETH’s new 2-year high has come at the expense of overleveraged traders. Per data from CoinGlass, over $273 million worth of positions have faced liquidations over the past day. Around 70,000 traders were liquidated, with Ethereum accounting for over $55 million ($33 million in shorts).

Ethereum Soars Past $3,000 as Liquidations Pile
Image via Coinglass

This liquidation figure outpaces that of Bitcoin ($52.9 million), which is a notably unusual occurrence given the stark difference in trading volume between both assets.

Ethereum Struggling with $3,000 Mark

The ETHUSD chart provided shows the token facing strong rejection around the $3,000 mark, pulling back slightly as of the time of this report. This emphasizes the risks highly leveraged traders face during volatile moves.

Ethereum Soars Past $3,000 as Liquidations Pile
ETHUSD 4-Hour Chart

One must set appropriate stops to limit the downside when aiming to profit from speculative upside targets.

Having tracked previous crypto market cycles, my assessment is that Ethereum often leads rallies. So, this breakout could signal further upside across altcoins.

I look to capitalize through disciplined trading aimed at outpacing Bitcoin’s gains. Want reliable crypto signals to capitalize on market swings? Join us on Telegram.


Interested in learning how to day trade crypto? Get all the information you need here

Tamadoge (TAMA/USD) Inch Closer to $0.006: Minor Shifts Detected

Since February 13th, when bulls intervened around the $0.0057 price level, demand has aligned with supply, establishing an equilibrium price. Consequently, the market has maintained a sideways range at this price level since then. However, from February 17th to the present, there have been slight adjustments in the TAMA/USD market dynamics. Bulls have identified a marginally higher support level at approximately $0.00581.

Key Levels

  • Resistance: $0.013, $0.014, and $0.015.
  • Support: $0.0045, $0.0040, and $0.0035.

Tamadoge (TAMA/USD) Inch Closer to $0.006: Minor Shifts Detected

TAMA/USD Price Analysis: The Indicators’ Point of View

The establishment of this slightly elevated support level is poised to facilitate a gradual upward price trajectory, potentially enabling a surpassing of the $0.006 threshold, provided that bulls persist in identifying enhanced rebound opportunities. However, as per the indicators, the TAMA/USD market is evidently in a state of equilibrium. The present trading session manifests as a doji candlestick pattern, aligning with the sideways movement of the 20-day moving average. Similarly, the Relative Strength Index (RSI) hovers close to the midpoint level. While there was an initial uptick in volatility over the past two days, prolonged market stasis could lead to further convergence of the Bollinger Bands, prolonging the consolidation phase.

Tamadoge (TAMA/USD) Inch Closer to $0.006: Minor Shifts Detected

Tamadoge Short-Term Outlook: 1-Hour Chart

Examining the current 1-hour session, the candlestick portraying this specific trading period is a doji, complemented by a notable histogram from the volume of trade indicator. The robust histogram indicates active involvement from both bulls and bears, yet the market remains indecisive about its direction. Should this indecision persist into the following session, further convergence of the Bollinger Bands may occur. This crypto signal, commonly referred to as a volatility squeeze, often precedes a pronounced bullish price movement.

Buy Tamadoge!

Do you want a coin that will be 100 times more valuable in the next few months? That is Tamadoge. Buy TAMA today!

Origin Protocol (OGN/USD) Bulls Rally to Safeguard $0.18 Support, Upholding Strength

The Origin Protocol market appears to be gaining bullish momentum following its breakout from the narrow price range around $0.16. Bulls swiftly secured a pivotal support level at $0.17, and in today’s trading session, the market surged above the $0.18 price mark. Furthermore, bullish activities observed thus far in today’s trading session have propelled the market close to the high of January 11th, which stands at $0.20, before a reversal ensued, triggered by the onset of bearish market conditions at that level.

Origin Protocol Market Data

  • OGN/USD Price Now: $0.183
  • OGN/USD Market Cap: $105 million
  • OGN/USD Circulating Supply: 573 million
  • OGN/USD Total Supply: 1 billion
  • OGN/USD CoinMarketCap Ranking: #401

Origin Protocol (OGN/USD) Bulls Rally to Safeguard $0.18 Support, Upholding Strength

Key Levels

  • Resistance: $0.190, $0.20, and $0.210.
  • Support: $0.170, $0.165, and $0.160.

The Origin Protocol Market Analysis: The Indicators’ Point of View

The surge in liquidity within the bull market has significantly heightened volatility levels in the Origin Protocol market. Consequently, we are witnessing a notable increase in price retracement. As a result, there is apprehension that the current bullish momentum may be curtailed, given the vigor of the ongoing price correction in the vicinity of the $0.20 price level. Nonetheless, it is evident that bulls are rallying around the $0.18 support level in an effort to sustain the bullish trend.

Upon examining the indicators, however, there appears to be potential for further bullish activity. The Relative Strength Index (RSI) still indicates momentum hovering around the 65.43 level, signifying robust bullish momentum. This crypto signal suggests that traders may remain inclined to purchase as the RSI line continues its upward trajectory.

Origin Protocol (OGN/USD) Bulls Rally to Safeguard $0.18 Support, Upholding Strength

OGN/USD 4-Hour Chart Outlook

However, based on the 4-hour chart analysis, the candlestick pattern observed in the current session indicates mounting selling pressure. The appearance of the inverted hammer candlestick, characterized by a pronounced upper shadow at the peak of the trend, suggests a potential bearish reversal. This formation signifies that following an upward movement, sellers exerted pressure, driving the price down from its peak, hinting at a possible shift in market sentiment from bullish to bearish. It is hoped that bulls will be able to defend their position at $0.18 against this increasing bearish pressure.

Trade crypto coins on BYBIT!

Dash 2 Trade Price Predictions for Today, February 20: D2TUSD Holds Strong at $0.01056 Price Level, Defying Bearish Pressure

Dash 2 Trade Price Forecast: D2TUSD Holds Strong at $0.01056 Price Level, Defying Bearish Pressure (February 20)
D2TUSD price remains strongly bullish as it holds strong at the upper resistance levels, defying the bearish pressure. The cryptocurrency has been experiencing a significant bullish trend over the past few days, driven primarily by the rising value of Bitcoin. The coin price will most likely continue its bullish run and the price could still go higher if the bulls can break up and close the 4-hour candle above the current price level at $0.01056, then we can expect a good upside momentum up to the $0.02000 upper resistance level and beyond, reflecting a growing interest and potentially increased liquidity in the coin market.

Key Levels:
Resistance levels: $0.00800, $0.00900, $0.01000
Support levels: $0.00500, $0.00400, $0.00300

D2T (USD) Long-term Trend: Bullish (4H Chart)
The D2TUSD price behavior on the higher time frame has been mainly bullish under the influence of an ascending trend pattern. Prices are seen trading strongly at the upper resistance level above the EMAs; this confirms its strong bullishness in present times.
Dash 2 Trade Price Predictions for Today, February 20: D2TUSD Holds Strong at $0.01056 Price Level, Defying Bearish Pressure
Pressure from the bulls to the $0.00905 supply value during the previous session has sustained the coin price above the supply trend levels in its recent high.

Today, with the renewed recovery pattern in the market, the Dash 2 Trade price moves aggressively up to the $0.01056 upper resistance level as the 4-hour chart commences.

Under the influence of this pattern, the positive upturn may push the coin price another 5.0% to hit a multiple resistance trend line around $0.02000.

Additionally, the daily stochastic suggests an uptrend. This indicates a bullish continuation upward, which will allow the bulls to continue the current rally and may soon result in the $0.0200 resistance trend line or higher in the long-term forecast.

D2T (USD) Medium-term Trend: Bullish (1H Chart)
Dash 2 Trade market remains strongly bullish on the medium-term outlook. The coin price is also trading strongly at the upper resistance level above the moving averages with huge volumes from the bulls.
Dash 2 Trade Price Predictions for Today, February 20: D2TUSD Holds Strong at $0.01056 Price Level, Defying Bearish Pressure
The coin has been having a series of higher highs and higher lows from the past session which has made it possible for the bulls to retain the strength in its recent high.

The bulls made a solid correction at the $0.01056 upper resistance value above the moving averages as the 1-hourly chart resumes today. This will encourage the buy traders to invest in the crypto, as possible future gains are certain.

Hence, maintaining above the moving average will allow the coin to rise higher, resulting in an intraday gain for the coin buyers.

Also, the market is currently trending upward as shown by the daily stochastic. This indicates that the market value of the D2TUSD will continue to rise, and this might be the best crypto signal to the coin traders.

In light of this, it is anticipated that the bulls will swing the coin price upward and may eventually hit the $0.02000 supply value in the next days in its medium-term perspective.


Want a coin that has a huge potential for massive returns? That coin is Dash 2 Trade. Buy D2T now.

$SPONGE (SPONGE/USD) Volatility Is Offering Potential Bullish Opportunities

In our recent analysis, it was observed that the $SPONGE market successfully broke out of its narrow price range around the $0.000035 threshold, subsequently rallying beyond the $0.0001 level. This notable bullish surge has prompted a surge in volatility levels, facilitating a retracement by bearish forces, which has brought the market close to its initial starting point of the preceding bullish trend, hovering near the $0.000035 mark. Presently, the crypto signal is pointing to the potential for bullish intervention at a higher support level, which could potentially drive the price upwards once more.

Key Market Dynamics:

  • Resistance Levels: $0.0010, $0.0011, and $0.0012.
  • Support Levels: $0.000035, $0.000030, and $0.000025.

$SPONGE (SPONGE/USD) Volatility Is Offering Potential Bullish Opportunities

In-Depth Technical Analysis for $SPONGE (SPONGE/USD)

We anticipate $SPONGE bullish intervention occurring even before the market reaches the critical $0.000035 price level. This expectation is supported by a decrease in bearish momentum, as evidenced by the volume of trade indicator. Notably, in the current trading session, the appearance of a red hammer candlestick suggests bullish activity, despite the candle’s color indicating a downward movement. As predicted, bulls are indeed entering the market from the key support level.

$SPONGE (SPONGE/USD) Volatility Is Offering Potential Bullish Opportunities

Insights from the 1-Hour Perspective:

The market’s volatility is notably apparent, particularly in the most recent one-hour session, as evidenced by the formation of a dragonfly doji on the chart. This candlestick pattern is significant within the context of a downtrend, signaling a potential reversal. It indicates that despite sellers’ efforts to drive prices downward, buyers have managed to assert control and could potentially close the session at or near this level. Consequently, we might anticipate a price rally in the upcoming trading session.

Buy SPONGE/USD!

Invest in the hottest and best meme coin. Buy Sponge ($SPONGE) today!

Dogecoin (DOGE/USD) Price Is Consolidating, Pushing Through Resistances

Dogecoin Price Prediction – February 19

There are slow-and-steady moving motions that have characterized the exchange lines between bulls and bears in the market operations of DOGE and USD, as it is headlined that the price is consolidating positively, pushing through resistances.

Since the price is averagely trading in the $0.090 zone, there appears to be more room for increases in the direction of the upper Bollinger Band trend line. That value line continues to be the crucial barrier that long-position movers must intentionally cross in the next erratic price movements in order to make up for steady upward running advances over the long term. A low around the middle Bollinger Band will be revisited upon a touch, with an active retracement around the line. However, investors shouldn’t turn to last-minute purchases.

DOGE/USD Market
Key Levels:
Resistance levels: $0.10, $0.11, $0.12
Support levels: $0.080, $0.075, $0.070

DOGE/USD – Daily Chart
The DOGE/USD daily chart showcases that the market is consolidating against the valuation of the US dollar, pushing through resistances.

The Upper Bollinger Band trend line has been steadily stretching northwardly in response to variant occurrences of bullish candlesticks. In the meantime, the trend pattern that price maintains within the points of $0.090 and $0.070 has been going sideways. As of the time of this technical piece, the stochastic oscillators have been placed in the overbought region to indicate that fresh opening of longing order needs to be careful about to avoid unnecessary traps in no time.
Dogecoin (DOGE/USD) Price Is Consolidating, Pushing Through Resistances

Given that the DOGE/USD market is currently stabilizing to the north, what tactic should pushers of long positions employ when attempting to initiate additional orders?

For purchasers to play along with the condition of consolidation, they need to be alert to when the price is tending to make a move after a session of pause, given that the DOGE/USD trade is pushing resistances slowly and systemically at this time.

Considering the likelihood of more upward movements, buyers in the DOGE/USD market will need to exert more pressure to let the price break over the $0.090 line, which it has been moving steadily higher toward. For the trade to produce steady gains, it won’t be optimal to combine a panicked shoot-up with swift corrective actions.

It has been noted that selling activity may pick back up between the $0.090 and $0.10 barrier points, particularly in the event that a sharp false move appears against the higher trading line. As a result, bears should exercise caution while attempting a recovery at this point along the upper Bollinger Band axis. To validate the best moment, at least two bearish candlesticks are required.
Dogecoin (DOGE/USD) Price Is Consolidating, Pushing Through Resistances
DOGE/BTC Price Analysis
In contrast, the Dogecoin market is found in a lower zone against the stances of Bitcoin, attempting to end, pushing through the imaginable underlying support points.

The Bollinger Band trend lines have curved to the south at significant lower points, enabling the construction of a candlestick pattern that may facilitate momentum-regaining mechanisms. The stochastic oscillators are indicating that the base cryptocurrency will push through some higher lines in the upcoming activities by traveling northward and pointing slightly in that direction.

Note: Cryptosignals.org is not a financial advisor. Do your research before investing your funds in any financial asset or presented product or event. We are not responsible for your investing results.


You can purchase Lucky Block here. Buy LBLOCK