Tamadoge (TAMA/USD) Awaits Bullish Momentum at $0.007

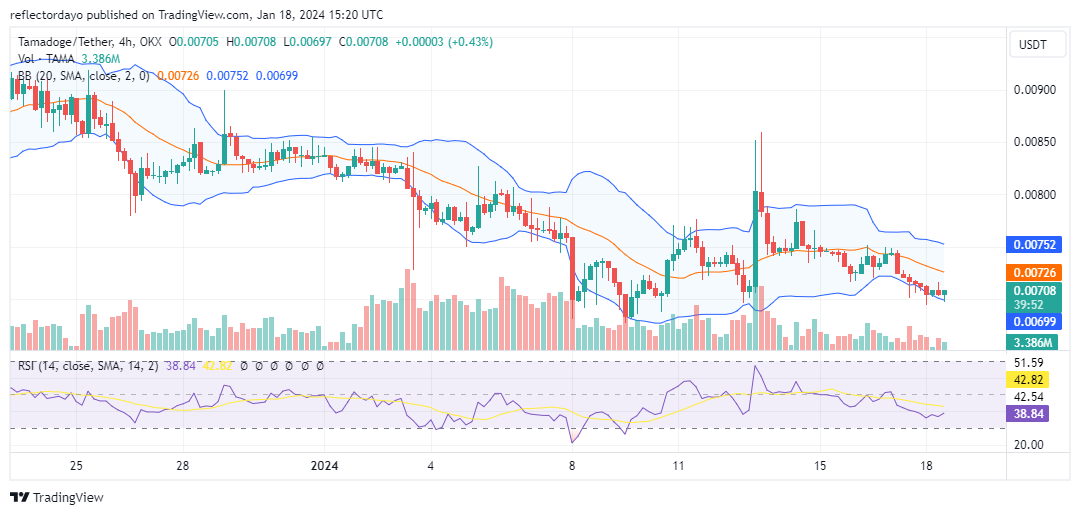
Initially, a  TAMA/USD bullish intervention was anticipated to unfold around the $0.0075 price level as bulls and bears became entangled in a price gridlock around this point. Contrary to expectations, the bears gained the upper hand, causing the market to decline towards the $0.0070 price level. Historically, this price level has proven to be a robust support for bullish trends, often halting several bearish market movements.

Given the historical significance of this level, there is a likelihood that the ongoing ranging bear market may not extend beyond this point, emphasizing the potential resilience of the $0.0070 support level in curbing further bearish momentum.

Key Levels

  • Resistance: $0.013, $0.014, and $0.015.
  • Support: $0.0070, $0.0068, and $0.0064.

Tamadoge (TAMA/USD) Awaits Bullish Momentum at $0.007

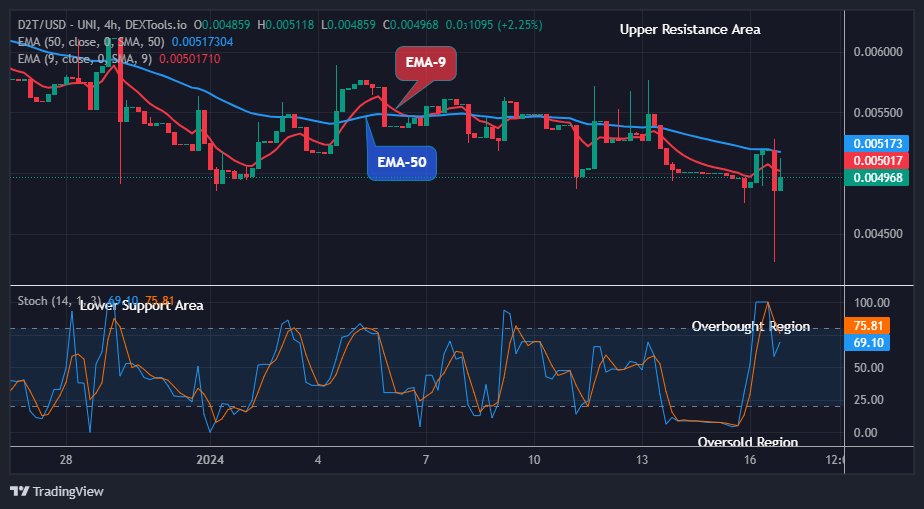
TAMA/USD Price Analysis: The Indicators’ Point of View

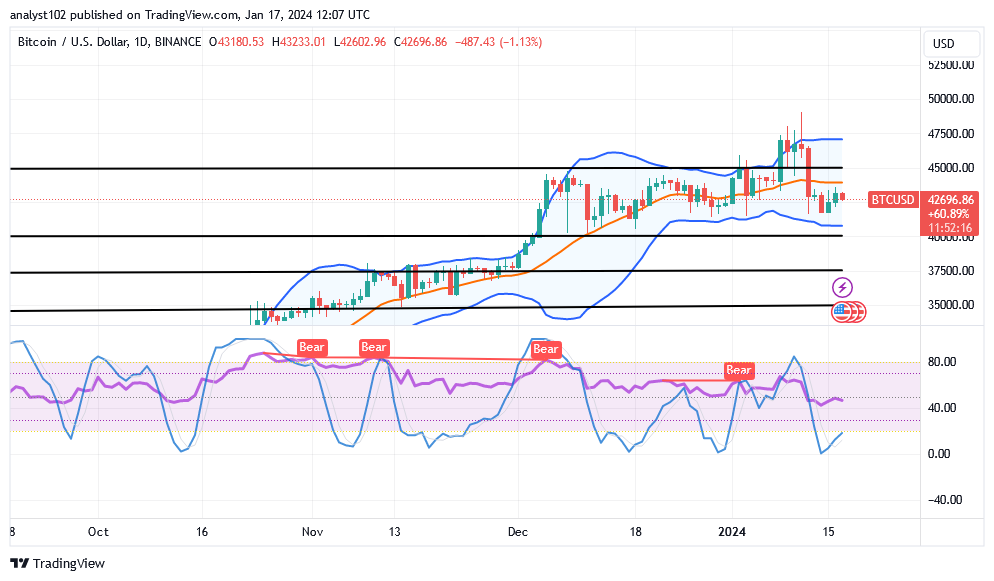
The TAMA/USD bears have made numerous attempts to drive the market below $0.007, but these efforts have consistently been unsuccessful. This suggests a prevailing bullish sentiment among traders in this area, making it unlikely for the market to decline below this threshold. Candlesticks around the $0.007 price level are already exhibiting bullish signals.

Despite the bearish indications from both the Bollinger Bands indicator and the Relative Strength Index (RSI), a bullish recovery is currently underway. The RSI line is undergoing a shift from a bearish trajectory to a bullish one, indicating a potential reversal in market sentiment.

Tamadoge (TAMA/USD) Awaits Bullish Momentum at $0.007

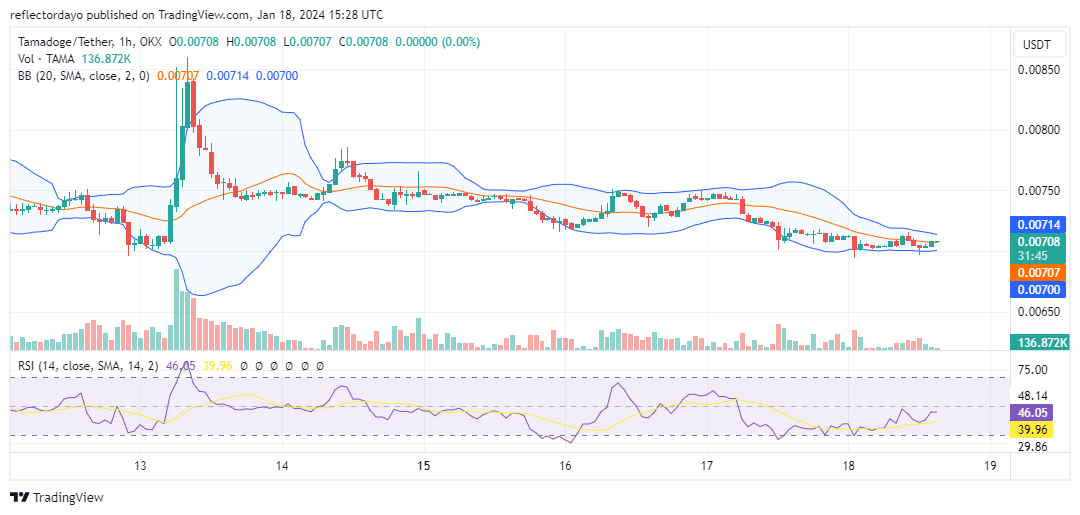
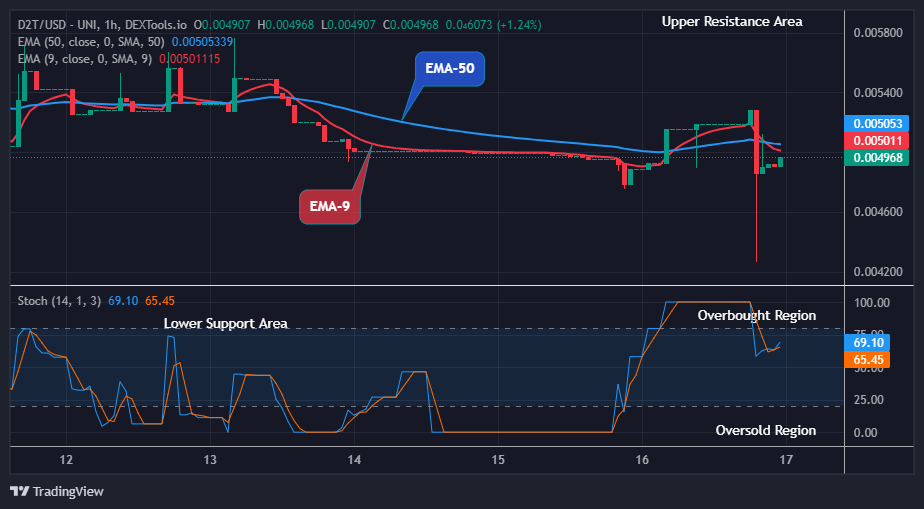
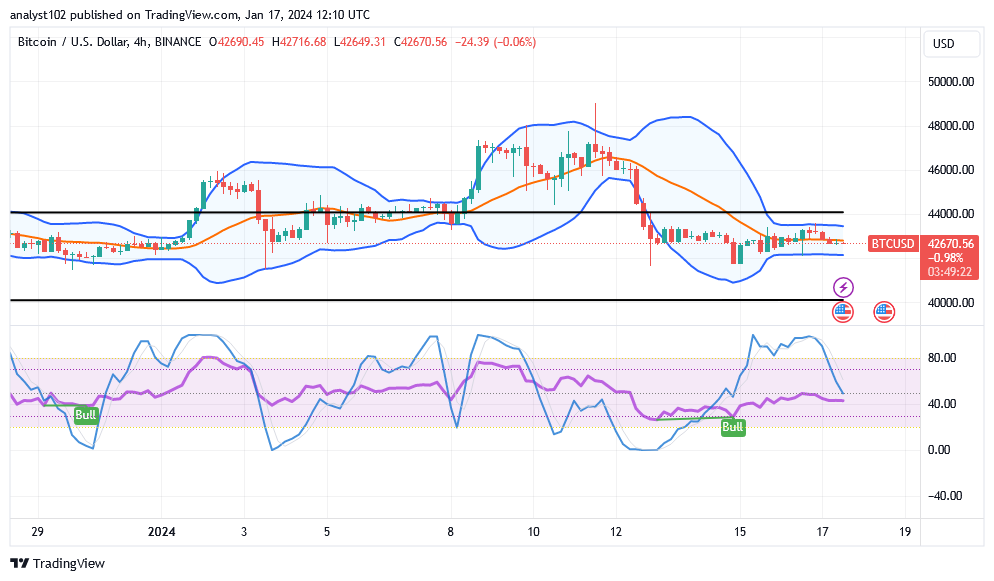
Tamadoge Short-Term Outlook: 1-Hour Chart

From this perspective, the Bollinger Bands are currently converging, signaling a peak in the standoff between demand and supply. The reduction in investor interest is contributing to a decrease in volatility, as reflected in the declining histograms of the volume of trade indicator. Anticipated is a forthcoming resumption of the market’s upward trajectory.

It is widely recognized that the opportune time to buy is when the market reaches its lowest point in a trend. As such, investors may find strategic entry points during periods of reduced volatility and converging Bollinger Bands.

Enter the world of Tamadoge games and see how much money you can make with $TAMA!

Do you want a coin that will be 100 times more valuable in the next few months? That is Tamadoge. Buy TAMA today!

Compound (COMP/USD) Price Consolidates at $56.00 as Bulls and Bears Engage in Market Battle

The support and resistance dynamics within the Compound market are displaying signs of convergence, and a potential point of confluence appears to be emerging around the $56.00 price level. Initially, the bearish market exhibited a strengthening momentum, with lower highs observed since the market peaked at $68 towards the end of last year. The consistent pattern of lower highs is indicative of a growing bearish trend.

However, a pivotal shift occurred in the market on January 13, when a support level was established around $53.00. This support level proved to be a significant turning point, introducing the possibility of market consolidation centered around the $56.00 price level. This shift in market dynamics suggests a potential equilibrium between bullish and bearish forces, warranting careful observation for further developments.

Compound Market Data

  • COMP/USD Price Now: $56.33
  • COMP/USD Market Cap: $456,245,838
  • COMP/USD Circulating Supply: 8,068,918 COMP
  • COMP/USD Total Supply: 10,000,000 COMP
  • COMP/USD CoinMarketCap Ranking: #122

Compound (COMP/USD) Price Consolidates at $56.00 as Bulls and Bears Engage in Market Battle

Key Levels

  • Resistance: $60.00, $65.00, and $70.00.
  • Support: $53.00, $50.00, and $45.00.

Compound Market Forecast: Analyzing the Indicators

In early January, a robust bear market emerged, nearly eroding the high price levels achieved by the bulls at the year-end of 2023, as bears drove the price down to around $45.00. Subsequently, bullish intervention successfully restored the price above the $50.00 level. The heightened bearish activity led to increased volatility, evident in the expansion of the Bollinger Bands.

However, as the bulls found support around the $52.00 price level, the Bollinger Bands indicator began exhibiting signs of convergence. This indicates a reduction in volatility, suggesting the potential for Compound market consolidation around the $56.00 price level. These market developments highlight the intricate interplay between bullish and bearish forces, necessitating continued vigilance for further insights.

Compound (COMP/USD) Price Consolidates at $56.00 as Bulls and Bears Engage in Market Battle

COMP/USD 4-Hour Chart Outlook

In a shorter timeframe, the market is currently undergoing consolidation, with price action gravitating towards the midpoint of the indicators employed in the analysis. Another confirmation of this consolidation trend is evident in the diminishing height of the volume histograms in the trade volume indicator. The ongoing deadlock between bulls and bears is resulting in a reduction in trading volume.

This market condition may lead to the establishment of either a support or a resistance level, ultimately guiding the market in a discernible direction. The resolution of this consolidation phase will likely provide clarity on the prevailing market sentiment and determine the subsequent trajectory.

Trade crypto coins on BYBIT!

Uniswap (UNI/USD) Price Is Under a Pressure, Hovering Below $7

Uniswap Price Prediction – January 18

The trading indicators of Bollinger Bands have remained trending northward to show that the trend making ups and downs has been bullish, as the UNI/USD market is under pressure, hovering below the line of $7.

It is psychologically best to always monitor points between $6 and $5.50 in the mode that shows an upward trend, as the price is not anticipated to push southerly beneath them to place below sustainably over the long term. The stochastic oscillators seem to need to be re-positioned at a lower end to point northward in returns in order for buyers to make comebacks after a line of reductions. That suggests that a force supporting the moves to the upside needs to be maintained after that.

UNI/USD Market
Key Levels:
Resistance levels: $7.50, $8, $8.50
Support levels: $6, $5.50, $5

UNI/USD – Daily Chart
The UNI/USD daily chart showcases that the crypto-economic market is under pressure, hovering below the line of $7.

The stochastic oscillators have managed to traverse northbound across variant points into the overbought region. A number of repelling trade signs have occurred on some candlesticks closely underneath the point of $7, indicating that bulls may hold back for a while to allow a line of corrections. The Bollinger Band trend lines are placed at the top around the point of $7.50, and their lower side is kept tightly beneath the value of $6.
Uniswap (UNI/USD) Price Is Under a Pressure, Hovering Below $7

As the price trades around $6.72 or thereabouts, what market tempo capability does the UNI/USD market have?

It is likely for bulls to relax in the UNI/USD market to let there be room for firm corrections, given that the crypto-economic price is under pressure, hovering below the point of $7.

Bollinger Bands’ mid-point zone has been showing traces of minor reversions, suggesting that long-position takers could still need to hold off on initiating a rallying motion. Given the realization of that feeling, the crucial underlying support level of $5.50 should hold and not break below the lower Bollinger Band trend line’s trend point.

Points of $7 and $7.50 need not be broken steadily past the moon direction as the trade situation is currently pondering a decline after the price tends to surge from a lower position. It will take some time for sellers to determine how and when the price will be most active in favor of falling around those
Uniswap (UNI/USD) Price Is Under a Pressure, Hovering Below $7
UNI/BTC Price Analysis
In contrast, the Uniswap market currently appears to be resettling toward putting itself back under declining pressure, hovering around the middle Bollinger Band.

Given that the stochastic oscillators are in the overbought area, there may be a pause in the price of the base cryptocurrency. And that can put it in a position where you see a series of downward movements. The Bollinger Bands are carefully tracking the locations of the majority of tactical climbs and falls.
\
Note: Cryptosignals.org is not a financial advisor. Do your research before investing your funds in any financial asset or presented product or event. We are not responsible for your investing results.


You can purchase Lucky Block here. Buy LBLOCK

Dash 2 Trade Price Predictions for Today, January 18: D2TUSD Price Set for a Potential Upswing

Dash 2 Trade Price Forecast: D2TUSD Price Set for a Potential Upswing (January 18)
Today, the D2TUSD pair is about to make the noise again in the crypto charts. The coin price is set for a potential upswing with a 2.57% after long hours of low dips. The coin is now facing the positive side while making new corrections. The price tested the multiple resistance zones near $0.004553 and we expect a swift increase to follow soon. The coin might jump towards the $0.3000 supply level amid renewed buying momentum if the sell traders reduce their tension in the market.

Key Levels:
Resistance levels: $0.00700, $0.00800, $0.00900
Support levels: $0.00500, $0.00400, $0.00300

D2T (USD) Long-term Trend: Bearish (4H Chart)
D2TUSD is trading in a bearish market zone in its long-term perspective. The prices can be seen below the moving averages at the moment. However, this cannot stay long as the market is currently facing its correctional phase.
Dash 2 Trade Price Predictions for Today, January 18: D2TUSD Price Set for a Potential Upswing
The order flow by the sell traders at the $0.00426 low value during the previous action has made the Dash 2 Trade price reduce a bit in price in its recent price level.

The bulls made an increase to a $0.00511 resistance level below the moving averages as a pullback as the 4-hour session opens today, as the buying pressure has just started.

Hence, buyers must redouble their efforts to forecast a bullish increase in the market above the $0.00611 level. Instead, as momentum continues to deteriorate, the sale will intensify.

Notably, the D2TUSD market suggests an uptrend on the daily signal, from the look of things, further downward may not likely be possible. The coin is gaining momentum now and may hit the $0.01000 supply level in the coming days in its higher time frame.

D2T (USD) Medium-term Trend: Bearish (1H Chart)
At the moment, the price of D2TUSD is struggling at a critical level. The price is now facing the upside approaching the moving averages.
Dash 2 Trade Price Predictions for Today, January 18: D2TUSD Price Set for a Potential Upswing
The sustained bearish pressure to the $0.00490 low level in the previous action has led to the coin’s recent price level.

The market price reversal at the $0.00496 supply value is an affirmation of bullish returns to the market and a possible next jump is likely.

The longer the price stays far above the mentioned level, the more pressure builds up to reach a key significant level at the upside.

The Dash 2 Trade pair is pointing up on the daily stochastic. This means that the coin market may remain and continue with the bullish momentum. Thus, buyers are expected to emerge and cluster around the market to push the price of the crypto forward.

Following this new trend, the price might reach the $0.01000 resistance level in the days ahead in its medium-term time frame.

Smart Money Insights: People and organizations perceived as knowledgeable and experienced, who frequently predict future trends, are known as smart money.


Want a coin that has a huge potential for massive returns? That coin is Dash 2 Trade. Buy D2T now.

Bitcoin (BTC/USD) Trade Is Converging, Making a Baseline

Bitcoin Price Prediction – January 17

In the recent trade sessions, a line of price actions has pushed in corrections after bulls lacked the capability to surge more sustainably past the resistance line of $47,500, meaning that the BTC/USD trade is currently converging at a lower spot above the point of $40,000, making a baseline.

Price action reversions have been combining a series of dips with rising moves to create opportunities for bulls to cover their opening positions above $40,000. It now appears that the value line is the critical support level to prevent the price from smoothly moving southward.

BTC/USD Market
Key Levels:
Resistance levels: $47,500, $50,000, $52,500
Support levels: $40,000, $37,500, $35,000

BTC/USD – Daily Chart
The BTC/USD daily chart showcases that the crypto-economic price is converging trade waves below the middle Bollinger Band, making a baseline.

The Bollinger Bands at the lower part have been demonstrating that the point of $40,000 is going to be tough for efforts to create a situation for further free fall-offs beyond the value point. The stochastic oscillators have dipped into the oversold region to exhibit that buyers are to fasten their belts against getting buy-in orders while the market shows a sign of recovery from a decline.
Bitcoin (BTC/USD) Trade Is Converging, Making a Baseline

What barrier trade line currently stands against the BTC/USD market as it trades around $42,696.86?

The basic bargaining line that has to be fearfully breached to the upside has been seen to be around the value line of $45,000, as the BTC/USD market is converging below the middle Bollinger Band, making a baseline.

The Bollinger Band trend lines are still generally systemically positioned to indicate that the primary resistance line is around $47,500 and the crucial support trade is at $40,000, where buyers should be wary of potential reversals. Long-position takers are encouraged to employ a shorter time frame chart, such as a 1-hour type, to monitor a decent and timely entrance.

Bears will need to use extreme caution as of the writing of this technical report to avoid any active movement that could result in losses as they pursue further lows towards $40,000.
Bitcoin (BTC/USD) Trade Is Converging, Making a Baseline
BTC/USD 4-hour Chart
The BTC/USD 4-hour chart shows the crypto trade is converging in the Bollinger Bands, making a baseline around the lower side.

The Bollinger Band trend lines are able to align themselves between the $4,000 and $42,000 values in a southerly direction. At the 40-point, the stochastic oscillators crossed over to the south, suggesting that a line of lows is speculatively moving southward to let the price regain positions that may lead back to construct an uprising motion path.


Note: Cryptosignals.org is not a financial advisor. Do your research before investing your funds in any financial asset or presented product or event. We are not responsible for your investing results.


You can purchase Lucky Block here. Buy LBLOCK

Ripple Boss Says IPO Not Coming Anytime Soon Amid SEC Hostility

In a recent interview with CNBC at the World Economic Forum (WEF) in Davos, Switzerland, Ripple CEO Brad Garlinghouse revealed that the company is not rushing to go public in the U.S. market due to the “hostile” stance of the Securities and Exchange Commission (SEC), according to The Block.

Garlinghouse criticized the lack of clarity and consistency in U.S. crypto regulation, citing the SEC’s lawsuit against Coinbase, a leading crypto exchange with an approved IPO.

“Trying to go public with a very hostile regulator that has to approve your S-1—that doesn’t sound like a lot of fun to me,” remarked Garlinghouse, pointing out that despite Coinbase’s approved S-1, the SEC is now suing them for actions outlined in their IPO filing.

Ripple, currently engaged in a protracted legal battle with the SEC over allegations of selling XRP as an unregistered security, has opted to delay any U.S. initial public offering until the lawsuit is resolved.

Ripple Is in a Good Place; It Doesn’t Need an IPO for Cash Inflows: Garlinghouse

Despite exploring other jurisdictions with clearer regulatory frameworks, Garlinghouse emphasized that Ripple, being cash flow positive for the past few years, doesn’t require immediate capital infusion through an IPO.

“We have looked at other jurisdictions that have clear rules of the road, but honestly, a lot of people go public because they need to raise capital,” said Garlinghouse. “Ripple is not really in a place where we need to raise capital, and so it is not a short-term priority.”

Ripple CEO Brad Garlinghouse
Ripple CEO Brad Garlinghouse | Image via CNBC

Expressing dissatisfaction with the current SEC Chair, Gary Gensler, Garlinghouse labeled him a “political liability” and expressed hope for a more crypto-friendly replacement.

Highlighting Ripple’s expansion in Europe and Africa, Garlinghouse emphasized the company’s commitment to providing cross-border payment solutions using XRP.

Despite the legal challenges, Ripple initiated a $285 million share buyback last week, valuing the company at $11 billion.

Garlinghouse stressed that an IPO would not serve as an exit for investors but rather as a strategic step in Ripple’s ongoing journey, emphasizing the importance of shareholder liquidity.


Interested In Learning How To Use Leverage While Trading? Find Out Here

Comparing Gold and Bitcoin ETFs: Investment Perspectives

Securing a milestone moment, the recent approval of bitcoin ETFs brings a sense of fulfillment. Having advocated for integrating a small portion of bitcoin into portfolios over the years, it’s gratifying to envision financial advisors universally endorsing this strategy. As a well-known union leader once said: ‘First, they ignore you, then they laugh at you, then they attack you, then they build monuments to you.’ Exploring the potential future, let’s draw insights from the trajectory of a comparable product: the growth of gold ETFs.

Gold ETFs: Custodians of Precious Metal Value for Effortless Investment

Gold, adored by investors and even pirates, maintains its value because it’s a limited resource. Yet, dealing with physical gold poses challenges—finding a trustworthy seller, securing storage, calculating value, and ensuring purity. The game-changing concept of a gold ETF emerged, allowing investors to own shares in a gold fund rather than dealing with the tangible metal. The trend started in Australia in 2003, gaining momentum with the launch of SPDR Gold Shares in the US in 2004. Its overwhelming success, with 50 million shares traded on day one, even caused platform crashes due to unprecedented demand.

By 2023, Gold ETFs evolved into a formidable $270 billion industry, and at the forefront stood SPDR Gold Shares, asserting its dominance and reshaping the landscape of gold investments.

Comparing Gold and Bitcoin ETFs: Investment Perspectives

Cryptocurrency Value for Effortless Investment

Bitcoin and gold share remarkable parallels—both dubbed ‘digital gold,’ operating outside the banking system for added trust. Yet, like gold, navigating Bitcoin’s complexities is a challenge. Enter Bitcoin ETFs: a game-changer. No more private keys, cold wallets, or security concerns. With ETFs, it’s as simple as buying stock shares; the fund manager handles the hassle. Integration, ease of trading, and avoiding dark alleys with sketchy dealers—it’s a whole new era for Bitcoin investing.

Financial Advisors Now Embrace Education for Commissions

As BlackRock advisors consider allocating up to 5% into the BlackRock Bitcoin ETF, a trend we’ve long advocated, the industry witnesses a fee war benefiting investors. Speculations arise of a substantial influx into Bitcoin ETFs, potentially propelling BTC to $100,000 or even $150,000 by year-end, although some argue it might be too rapid. Our steady-drip investing approach, buying bitcoin monthly, proves successful, surpassing ordinary returns. Embrace simplicity – now, manage stocks, bonds, and Bitcoin ETFs seamlessly from a single online broker account.

Trade crypto coins on BYBIT!

Chiliz (CHZUSD) Witnesses Explosive Growth as Buyers Take Charge

CHZUSD Analysis – Buyers are Open for More Purge

Chiliz (CHZUSD) has experienced a significant surge in value this week, with buyers taking bold steps that they haven’t in a while. The cryptocurrency market, which has been relatively low on liquidity, has suddenly seen a boost. There has been a recent liquidity purge as buyers have made an impressive demonstration of their buying power. They have successfully breached the $0.09500 significant level, which they had been struggling to surpass. In addition to breaking through this level, buyers have pushed the price forward toward the $0.1110000 mark.

Chiliz Significant Zones

Resistance Zones: $0.111000, $0.133300
Support Zones: $0.095000, $0.052200

Chiliz (CHZUSD) Witnesses Explosive Growth as Buyers Take Charge

Chiliz has been in a ranging market for several months, and it comes as no surprise that traders have been anticipating a breakout. The bulls and bears have been engaged in a back-and-forth battle within the $0.095000 and $0.1110000 price zones for quite some time.

The recent breakthrough indicates a significant increase in liquidity flow in the market. However, the buyers have slowed down as price volatility has reduced around the $0.1110000 market zone. This calls for caution among buy traders, who may be tempted to jump into the scene without proper analysis.

The Stochastic Oscillator, a technical indicator used to measure momentum, is currently heading back to the overbought region. If the bullish tendency is expected to continue, a successful breakout and retest should be anticipated before entering the market. It is crucial to ensure that the breakout is confirmed and not a false signal. Traders should exercise patience and wait for a clear indication of sustained bullish momentum.

Chiliz (CHZUSD) Witnesses Explosive Growth as Buyers Take Charge

Market Expectation

Analyzing the Bollinger Band indicator in the short-term timeframe can provide insights into price volatility. Although buyers are likely to maintain some pressure in the market for the time being.

You can purchase Lucky Block here.  Buy LBLOCK

Note: Cryptosignals.org is not a financial advisor. Do your research before investing your funds in any financial asset or presented product or event. We are not responsible for your investing results.

ApeCoin Retains a Conservative Tempo Amidst Low Volatility

Market Analysis – Buyers Show Aggression 

The price of ApeCoin has remained relatively quiet for the past few weeks, despite the buyers’ efforts to push it forward. The buyers have been making aggressive attempts to counter the dominance of the sellers. This is because the market has been experiencing depreciation since the beginning of the year.

APEUSD Key Levels

Resistance Levels: $2.800, $2.200
Support Levels: $1.500, $1.240

ApeCoin Retains a Conservative Tempo Amidst Low VolatilityIn December, ApeCoin showed less volatility as the price consolidated. However, the bulls were not strong enough to approach the key level of $2.000. As the new year began, the bears exerted their influence by breaking through the market level of $1.590. Throughout this month, the sellers have been able to extend their progress down to the market zone of $1.200.

The current struggle is evident as the buyers attempt to change the market setup. This has led to a serious battle, with ApeCoin also lacking a clearer sense of direction. With the buyers fighting against the sellers, the tug of war is likely to continue for a while. The Moving Average crossing indicates that the sellers are still in the flow and have not yet been pushed out.

ApeCoin Retains a Conservative Tempo Amidst Low Volatility

Market Expectation

If the buyers fail to win this battle, ApeCoin is bound to fall back. Traders should anticipate the crypto price falling back to the critical level of $1.500. In this short time frame, the bulls and bears are still engaged in battle. Currently, ApeCoin lacks the volatility necessary for traders to push the price further.

You can purchase Lucky Block here. Buy LBLOCK

NoteCryptosignals.org is not a financial advisor. Do your research before investing your funds in any financial asset or presented product or event. We are not responsible for your investing results.